Download
1 / 1
10 likes | 155 Views
Sensory Re-Weighting In Human Postural Control During Moving-Scene Perturbations A. Mahboobin 1 , P. Loughlin 1,2 , Ph.D., M. Redfern 3,2 , Ph.D., and P. Sparto 2,3 , Ph.D. Depts. Of 1 Electrical Engineering, 2 Bioengineering, and 3 Otolaryngology, University of Pittsburgh, Pittsburgh, PA.

E N D
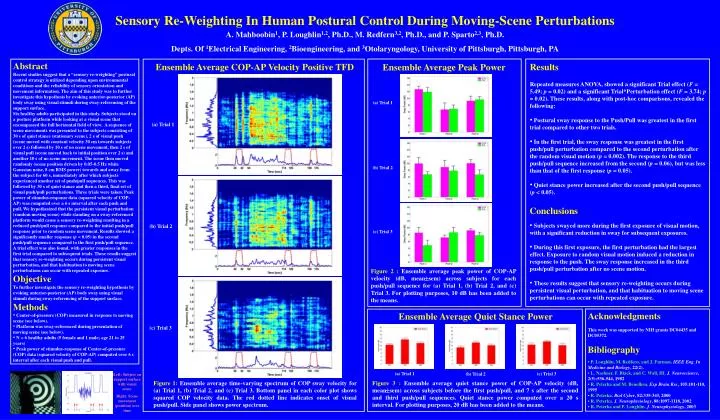
Sensory Re-Weighting In Human Postural Control During Moving-Scene Perturbations A. Mahboobin1, P. Loughlin1,2, Ph.D., M. Redfern3,2, Ph.D., and P. Sparto2,3, Ph.D. Depts. Of 1Electrical Engineering, 2Bioengineering, and 3Otolaryngology, University of Pittsburgh, Pittsburgh, PA • Abstract • Recent studies suggest that a “sensory re-weighting” postural control strategy is utilized depending upon environmental conditions and the reliability of sensory orientation and movement information. The aim of this study was to further investigate this hypothesis by evoking anterior-posterior (AP) body sway using visual stimuli during sway-referencing of the support surface. • Six healthy adults participated in this study. Subjects stood on a posture platform while looking at a visual scene that encompassed the full horizontal field of view. A sequence of scene movements was presented to the subjects consisting of 30 s of quiet stance (stationary scene), 2 s of visual push (scene moved with constant velocity 30 cm towards subjects over 2 s) followed by 10 s of no scene movement, then 2 s of visual pull (scene moved back to initial position over 2 s) and another 10 s of no scene movement. The scene then moved randomly (scene position driven by 0.05-0.5 Hz white Gaussian noise, 8 cm RMS power) towards and away from the subject for 60 s, immediately after which subjects experienced another set of push/pull sequences. This was followed by 30 s of quiet stance and then a third, final set of visual push/pull perturbations. Three trials were taken. Peak power of stimulus-response data (squared velocity of COP-AP) was computed over a 6 s interval after each push and pull. We hypothesized that the persistent visual perturbation (random moving scene) while standing on a sway-referenced platform would cause a sensory re-weighting resulting in a reduced push/pull response compared to the initial push/pull response prior to random scene movement. Results showed a significantly smaller response (p < 0.05) in the second push/pull sequence compared to the first push/pull sequence. A trial effect was also found, with greater responses in the first trial compared to subsequent trials. These results suggest that sensory re-weighting occurs during persistent visual perturbation, and that habituation to moving scene perturbations can occur with repeated exposure. • Objective • To further investigate the sensory re-weighting hypothesis by evoking anterior-posterior (AP) body sway using visual stimuli during sway-referencing of the support surface. • Methods • Center-of-pressure (COP) measured in response to moving scene (see below). • Platform was sway-referenced during presentation of moving scene (see below). • N = 6 healthy adults (5 female and 1 male; age 21 to 25 years) • Peak power of stimulus-response of Center-of-pressure (COP) data (squared velocity of COP-AP) computed over 6 s interval after each visual push and pull. Ensemble Average COP-AP Velocity Positive TFD • Results • Repeated measures ANOVA, showed a significant Trial effect (F = 5.49; p = 0.02) and a significant Trial*Perturbation effect (F = 3.74; p = 0.02). These results, along with post-hoc comparisons, revealed the following: • Postural sway response to the Push/Pull was greatest in the first trial compared to other two trials. • In the first trial, the sway response was greatest in the first push/pull perturbation compared to the second perturbation after the random visual motion (p = 0.002). The response to the third push/pull sequence increased from the second (p = 0.06), but was less than that of the first response (p = 0.05). • Quiet stance power increased after the second push/pull sequence (p < 0.05). Ensemble Average Peak Power (0.5 Hz, 2 deg) (a) Trial 1 (a) Trial 1 (b) Trial 2 • Conclusions • Subjects swayed more during the first exposure of visual motion, with a significant reduction in sway for subsequent exposures. • During this first exposure, the first perturbation had the largest effect. Exposure to random visual motion induced a reduction in response to the push. The sway response increased in the third push/pull perturbation after no scene motion. • These results suggest that sensory re-weighting occurs during persistent visual perturbation, and that habituation to moving scene perturbations can occur with repeated exposure. (b) Trial 2 (c) Trial 3 Figure 2 : Ensemble average peak power of COP-AP velocity (dB, meansem) across subjects for each push/pull sequence for (a) Trial 1, (b) Trial 2, and (c) Trial 3. For plotting purposes, 10 dB has been added to the means. • Acknowledgments • This work was supported by NIH grants DC04435 and DC05372. • Bibliography • P. Loughlin, M. Redfern, and J. Furman.IEEE Eng. In Medicine and Biology, 22(2). • L. Nashner, F. Black, and C. Wall, III.J. Neuroscience, 2(5):536-544, 1982 • R. Peterka and M. Benolken.Exp Brain Res, 105:101-110, 1995 • R. Peterka.Biol Cyber, 82:335-343, 2000 • R. Peterka. J. Neurophysiology, 88:1097-1118, 2002 • R. Peterka and P. Loughlin. J. Neurophysiology, 2003 Ensemble Average Quiet Stance Power (c) Trial 3 (a) Trial 1 (c) Trial 3 (b) Trial 2 Left: Subject on support surface with visual scene. Right: Scene movement (position) over time Figure 1: Ensemble average time-varying spectrum of COP sway velocity for (a) Trial 1, (b) Trial 2, and (c) Trial 3. Bottom panel in each color plot shows squared COP velocity data. The red dotted line indicates onset of visual push/pull. Side panel shows power spectrum. Figure 3 : Ensemble average quiet stance power of COP-AP velocity (dB, meansem) across subjects before the first push/pull, and 7 s after the second and third push/pull sequences. Quiet stance power computed over a 20 s interval. For plotting purposes, 20 dB has been added to the means.