Download

1 / 15
160 likes | 566 Views
Correlation & the Coefficient of Determination. (Session 04). Learning Objectives. At the end of this session, you will be able to understand the meaning and limitations of Pearson’s coefficient of correlation (r)

E N D
Correlation & the Coefficient of Determination (Session 04)
Learning Objectives At the end of this session, you will be able to • understand the meaning and limitations of Pearson’s coefficient of correlation (r) • describe what is meant by the coefficient of determination (R2) and how it relates to r for a simple linear regression model • derive the value of R2 using results of an analysis of variance.
What is Correlation? The term “correlation” refers to a measure of the strength of association between two variables. If the two variables increase or decrease together, they have a positive correlation. If, increases in one variable are associated with decreases in the other, they have a negative correlation.
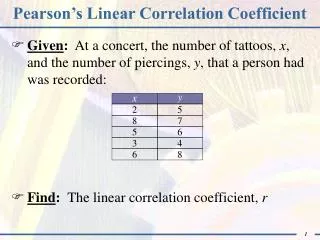
Linear Correlation (r) For two quantitative variables X and Y, for which n pairs of measurements (xi, yi) are available, Pearson’s correlation coefficient (r) gives a measure of the linear association between X and Y. The formula is given below for reference.
Linear Correlation (r) If X and Y are perfectly positively correlated, r = 1 If there is absolutely no association, r = 0 If X and Y are perfectly positively correlated, r = -1 Thus -1 < r < +1 The closer r is to +1 or -1, the greater is the strength of the association.
Coefficient of Determination It is often difficult to interpret r without some familiarity with the expected values of r. A more appropriate measure to use when interest lies in the dependence of Y on X, is theCoefficient of Determination, R2. It measures the proportion of variation in Y that is explained by X, and is often expressed as a percentage.
Using anova to find R2 Anova (for 93 rural female headed HHs) of log consumption expenditure versus number of persons per sleeping room is: R2 = Regre. S.S. / Total S.S. = 4.89/25.23 = 0.194
Interpretation of R2 From above, we can say that 19.4% of the variability in the income poverty proxy measure is accounted for by the number of persons per sleeping room. Clearly there are many other factors that influence the poverty proxy since over 80% of the variability is left unexplained!
Relationship of R2 to r When there is just one explanatory variable being considered (as in above example), the squared value of r equals R2. In the above example, value of r = - 0.194 = - 0.44 The negative value is used when taking the square root because the graph indicates a negative relationship (see next slide).
Benefits of R2 and r • r is useful as an initial exploratory tool when several variables are being considered. The sign of r gives the direction of the association. • R2 is useful in regression studies to check how much of the variability in the key response can be explained. • R2 is most valuable when there is more than one explanatory variable. High values of R2 are particularly useful when using the model for predictions! (More on this later!)
Limitations of r • Observe that seemingly high values of r, e.g. r=0.70, explain only about 50% of the variability in the response variable y.So take care when interpreting correlation coefficients. • a low value for r does not necessarily imply absence of a relationship – could be a curved relationship! So plotting the data is crucial! • Tests exist for testing there is no association. But depending on the sample size, even low values of r, e.g. r=0.20 can give significant results – not a very useful finding!
Limitations of R2 • Note that R2 is only a descriptive measure to give a quick assessment of the model. Other methods exist for assessing the goodness of fit of the model. • Adding explanatory variables to the model always increases R2 . Hence in practice, it is more usual to look at the adjusted R2 • The adjusted R2is calculated as • 1 – (Residual M.S./Total M.S.) • As with R2, the adjusted R2 is often expressed as a percentage.
Practical work follows to ensure learning objectives are achieved…