Download
1 / 36
360 likes | 504 Views
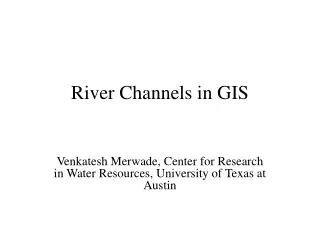
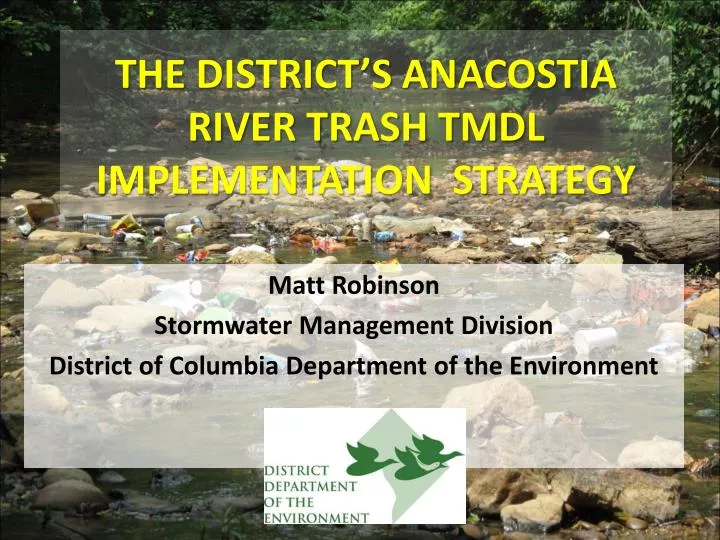
THE DISTRICT’S ANACOSTIA RIVER TRASH TMDL IMPLEMENTATION STRATEGY. Matt Robinson Stormwater Management Division District of Columbia Department of the Environment. What We Will Touch On Today. The MS4 Trash Implementation Strategy The MS4 Trash Load Reduction Calculation Methodology.

E N D
THE DISTRICT’S ANACOSTIA RIVER TRASH TMDL IMPLEMENTATION STRATEGY Matt Robinson Stormwater Management Division District of Columbia Department of the Environment
What We Will Touch On Today • The MS4 Trash Implementation Strategy • The MS4 Trash Load Reduction Calculation Methodology
Development of the Trash TMDL Waste Load Allocation + Load Allocation + Margin of Safety = TMDL Illegal Dumping Account for Uncertainty MS4 CSO The Goal: Reduction of 100% of the baseline load
Development of the Trash TMDL Baseline load for the CSO was developed by monitoring Fresh Creek Netting System at CSO 018 in SW DC.
Development of the Trash TMDL • Baseline load for the MS4 was developed by monitoring 10 outfalls in the Anacostia watershed. • Data collected was used to develop “trash loading” coefficients for 12 land use types (e.g. low density residential, commercial, industrial, etc.).
Total Source Loads • Combined Sewer estimated to produce ~94,000 lbs/yr (CSO serves ~49.2% of the watershed) • MS4 estimated to produce ~103,000 lbs/yr (MS4 serves ~50.8% of the watershed) • Total non-point source load ~ 20,000 lbs/yr MS4
The Implementation Strategy • Two major policies pushing compliance: • District’s MS4 Permit 2. The Long Term Control Plan (aka The Clean Rivers Project) for the Combined Sewer • Per the most recent MS4 permit, the strategy presented today will focus only on addressing the MS4 waste load allocation.
The Priority: Addressing Hotspot Sewersheds Avg Trash Load for all sewersheds Hotspots are Priorities for Structural Controls
The Priority: Addressing Hotspot Sewersheds We currently have installed, or will be installing soon, devices at three out of our six hotspot sewersheds.
Examples of Structural Controls Bandalong Litter Traps
Examples of Structural Controls Custom trash trap designed, built, and maintained by Anacostia Watershed Society (AWS)
Examples of Structural Controls Hickey Run Stormwater BMP
The Benefits of Structural Practices • 43,000 to 45,000 pounds of trash per year could be captured using structural practices (based on observed efficiencies for currently implemented practices). • We will strive over the next four years to install as many structural practices as possible.
Non-Structural Practices • Not all outfalls are suitable for end-of-pipe treatment. • There are issues concerning access, condition of outfalls, etc. • If we can’t use structural practices, a suite of non-structural practices will be employed.
Non-Structural Practices • The following practices will be employed: • Education and Outreach • Regulatory Approaches (e.g. Bag Law) • Street sweeping of environmental hotspots • Skimmer boat activities • Stream and river cleanup activities • Roadway and block cleanup activities
Examples of Non-Structural Practices • The Potomac Watershed Wide • Anti – Littering Campaign
Examples of Non-Structural Practices Anacostia River Clean-Up & Protection Act of 2009 (the Bag Law)
Non Examples of Non-Structural Practices • Beginning in 2011, we implemented an enhanced street sweeping program with DC DPW. • DPW now spends an extra two days a month sweeping “environmental hot spots,” or street blocks identified in the 2009 Anacostia Watershed Trash Reduction Plan published by AWS, and funded by DDOE.
Load Reduction Calculation Methodology • Trash load reduction calculation methodology was developed for the 2012 MS4 Permit Annual Report. • The methodology we are presenting today includes pollutant reduction efficiency calculations for the following practices: • Street Sweeping Environmental Hotspots in the MS4 Area • Trash Clean-Up Events • Skimmer Boats • Hickey Run BMP • Marvin Gaye Park (Upper Watts) Bandalong • Nash Run Trash Trap • Bag Law
Load Reduction Calculation Methodology • Calculating trash load reductions via street sweeping of environmental hotspots: Using GIS, we estimate we currently sweep 580 acres of roadway in the hotspots 580 acres x 50% That gives us 290 acres X 31.12 lbs/acre That gives us 9,048 lbs X 16 X 50% (Up to half of the roadway may not be swept at a time because these areas are unsigned) (Trash TMDL loading coefficient for roadways) (DPW sweeps hotspots twice per month, 8 months out of the year. However not all hotspots may be swept, so we only take credit for sweeping half of the area) Total Reduction = 72,384 lbs/yr
Load Reduction Calculation Methodology • Calculating trash load reductions via clean up events: Based on empirical data collected during the 2012 AWS Earth Day Cleanup, 37,647 lbs of trash collected X 16.5% 6,212 lbs of trash X 50.8% 3,156 lbs of trash X 20% (16.5% of the Anacostia watershed is in the District) (50.8% of the District’s portion of the Anacostia served by the MS4) (80% reduction accounts for the fact that not all glass and plastic bottles may have been emptied of water ) Total Annual Reduction = 631 lbs/yr
Load Reduction Calculation Methodology • Calculating trash load reductions via Skimmer Boats: Based on data collected by DC Water in 2012 700,000 lbs of trash/debris was collected X 16.5% That gives us 115,793 lbs X 50.8% That gives us 58,776 lbs X 50% (50% of the material captured may actually be trash) That gives us 29,388 lbs X 20% (80% reduction accounts for not all plastic and glass bottles being emptied of water) (16.5% of the Anacostia watershed is in the District) ( 50.8% of the District’s portion of the Anacostia is served by the MS4) Total Annual Reduction = 5,877 lbs/yr
Load Reduction Calculation Methodology • Calculating trash collected by the Hickey Run BMP: The BMP was designed to collect at least 10,000 pounds of trash per year 10,000 lbs of trash X 20% (80% reduction accounts for the wet weight of trash) Total Annual Reduction = 2,000 lbs/yr
Load Reduction Calculation Methodology • Calculating trash collected by Marvin Gaye Park Bandalong: Based on empirical data collected between December 2011 & 2012 2,606 lbs of trash was collected X 2% (Approximately 2% of the Watts Branch watershed that lies within the District drains to the trap) Total Annual Reduction = 52 lbs/yr
Load Reduction Calculation Methodology • Calculating trash collected by the Nash Run Trash Trap: Based on the annual average (2009-2012) for trash collected, the trap is currently collecting 1,894 lbs per year. 1,894 lbs of trash collected X 75% (Approximately 75% of the Nash Run watershed lies within the District and drains to the trap) Total Annual Reduction = 1,420 lbs/yr
Load Reduction Calculation Methodology Calculating trash load reductions for the Bag Law: • Establishing the baseline for number of bags in the river and it’s tributaries • Based on empirical data collected for the 2008 Anacostia Trash Reduction Plan, we estimate that there are 1.25 bags/foot of stream and 0.11 bags/foot of river • Next, Using GIS we estimated that in the DC portion of the Anacostia watershed there are 62,156 linear feet of stream and 44,469 linear feet of river • So, 1.25 bags/ foot of stream X 62,156 feet of stream = 77,521 bags and, 0.11 bags/foot of river X 44,469 feet of river = 4,910 bags • 77,521 + 4,910 = 82,431 bags currently in the Anacostia river and tributaries.
Load Reduction Calculation Methodology • Estimating the Reduction: 82,431 bags X 50.8% (area of the DC Anacostia Watershed served by the MS4) 41,875 bags X 50% (According to recent findings, businesses report 50% reduction in their bag purchases) 20,937 bags X 0.013 lbs (weight of standard plastic grocery bag) Total Annual Reduction = 272 lbs/yr
Load Reduction Calculation Methodology • We are currently not applying reduction factors to two of the following structural practices: • James Creek Bandalong Litter Trap • Kenilworth Park Bandalong Litter Trap • The drainage area for both of these devices is located entirely within the District, and within the MS4 area.
Load Reduction Calculation Methodology • We are currently assessing efficiencies for other practices including: • Roadway and Block Cleanups • Education and Outreach • Altogether, these conservative estimates show that DC is currently removing 85,218 lbs per year from the Anacostia using structural and non-structural practices.
Monitoring • Trash was listed as a priority pollutant in the 2012 MS4 Permit. • Monitor 6 outfalls throughout the District, including 3 in the Anacostia watershed. • This will help us assess whether our efforts are making a difference.
Next Steps • DDOE will be releasing this draft strategy and load reduction calculation methodology on their website. • The draft strategy will be emailed to constituents throughout the District and the region. • DDOE will be accepting public input through January 31st, 2014. • Please submit your comments in writing to Matt Robinson of the Stormwater Management Division (contact info. on next slide). • DDOE will continue to update our strategy as new practices are implemented.
Matt Robinson Implementation Branch Stormwater Management Division District of Columbia Department of Environment 202-442-3204 matthew.robinson@dc.gov