Download
1 / 21
210 likes | 212 Views
This presentation explores the use of logic models to help research and technology programs demonstrate their value. Using a federal energy efficiency and renewable energy program as an example, the logic model illustrates how programs can identify indicators, performance targets, and evaluation questions. The presentation also discusses the increasing pressure on RDD&D programs to demonstrate their value and the requirements set by the Government Performance and Results Act of 1993.

E N D
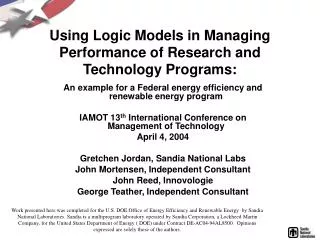
Using Logic Models in Managing Performance of Research and Technology Programs: An example for a Federal energy efficiency and renewable energy program IAMOT 13th International Conference on Management of Technology April 4, 2004 Gretchen Jordan, Sandia National Labs John Mortensen, Independent Consultant John Reed, Innovologie George Teather, Independent Consultant Work presented here was completed for the U.S. DOE Office of Energy Efficiency and Renewable Energy by Sandia National Laboratories. Sandia is a multiprogram laboratory operated by Sandia Corporation, a Lockheed Martin Company, for the United States Department of Energy ( DOE) under Contract DE-AC04-94AL8500. Opinions expressed are solely those of the authors.
Presentation Overview • Managers are under increasing pressure to demonstrate the value of their programs • Logic models can help programs identify and explain their value • Logic models can include strategies that represent research, development, demonstration and deployment (RDD&D) stages • Logic model example for federal energy program • Logic models help programs identify: • Indicators • Performance targets • Evaluation questions
There is increasing pressure on RDD&D programs to demonstrate value U.S. Requirements: • Government Performance and Results Act of 1993 (GPRA) requires agencies to develop: • Strategic plans • Annual performance plans • Annual performance reports • OMB’s Program Assessment Rating Tool (PART) scores programs on: • Program purpose and design • Strategic planning • Program management • Program results
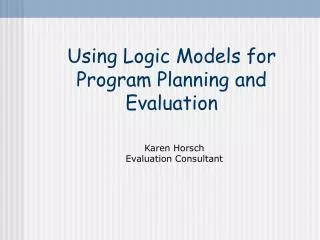
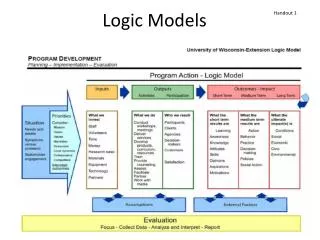
Logic models help programs identify value • A logic model is a diagram or table describing how a program will solve identified problems • Elements of a logic model include: • Resources (Inputs) • Activities • Outputs • Customers reached • Outcomes • Short • Intermediate • Long-term • External influences
Basic logic model structure Intermediate Outcomes (through customers) Long-Term Outcomes & Problem Solution Resources (Inputs) Activities Outputs for Customers Reached Short-Term Outcomes External Influences and Related Programs (mediating factors)
A logic model example • A logic model was developed for the U.S. Department of Energy’s Office of Energy Efficiency and Renewable Energy (EERE) • EERE’s goals are to: • Modernize energy conservation • Increase energy supplies • Modernize our critical energy infrastructure
EERE has 7 strategies for achieving its goals • Plan and assess programs • Develop and maintain program infrastructure • Conduct research • Develop technology • Demonstrate technology • Develop government and market infrastructure • Deploy technology
The 7 strategies cover stages in the RDD&D spectrum and are not necessarily linear R D D D Program planning & assessment Develop & maintain program infrastructure Conduct research Develop technology Demonstrate technology Developing government & market infrastructure Deploy technology Feedback Loops
The strategies are represented as “activities” in the draft logic model Inputs Program planning & assessment Develop & maintain program infrastructure Conduct research Develop technology Demonstrate technology Developing government & market infrastructure Deploy technology Activities Feedback Loops Outputs For Outcomes
External Influences Federal, state & local government funding Private funding, Personnel, Facilities, Past R&D results Political environment Quality of R&D proposals Unpredictable nature of R&D Cost and performance of competing technologies Industry willingness to take risk Energy prices State of the economy Government policies and regulations Inputs Program planning & assessment Develop & maintain program infrastructure Conduct research Develop technology Demonstrate technology Developing government & market infrastructure Deploy technology Activities Feedback Loops Benefit estimates, Priorities identified, Budget requests, Program plans Public & private labs and test beds, Knowledge bases, Trained S&T personnel, Partnerships New knowledge, proof of concepts as represented by data, publications Technology prototypes -initial -intermediate -commercial Performance analysis Test, improve, & validate commercial- scale technology, Give industry hands-on experience Codes and standards, Trained personnel, Audits tools, State programs Government purchases, Information disseminated, Early seeding of technologies Outputs Programs, CFO, OMB, Congress R&D Community, Industry Programs, partners R&D community Relevant industries Relevant markets Potential purchasers For Program funding in appropriate areas; Efficiency, Fiscal responsibility Relevant S&T expertise, capabilities and facilities to deliver programs Concepts & designs with possible applications, Knowledge spill-over Potentially commercializ-able technologies to replace existing or fill a system need Investment by industry in innovative or advanced commercial products Favorable policies, capable delivery channels for EERE products Widespread adoption of EERE products; More productive use of energy Outcomes National R&D capabilities, including options if circumstances change Spin-off products and their associated benefits New products & businesses Economic, security, and environmental benefits Technology leadership EERE’s draft logic model shows how its strategies/activities are linked to its goals
Logic models help programs identify: • Measurement areas for which indicators (metrics) may be developed • Performance targets for each indicator • Evaluation questions
External Influences Cost and performance of competing technologies (varies by technology) Oil prices ($/barrel) NG prices ($/tcf) Electricity prices (c/kWh) Coal prices ($/ton) GDP (billion 1996 $) RE production tax credit (c/kWh) EE/RE tax credits ($) CAFÉ standards (mpg) Vehicle & power plant emission standards (varies by pollutant) Federal funding (millions of nominal $) Federal personnel (FTEs) Private funding (millions of nominal $) # of RD&D facilities Inputs Program planning & assessment Develop & maintain program infrastructure Conduct research Develop technology Demonstrate technology Developing government & market infrastructure Deploy technology Activities Feedback Loops % programs w/benefit estimates % program w/program plans # of partnerships # of journal articles # of presentations # prototypes -initial -intermediate -commercial Prototype cost & performance # and % of commercial- scale technologies validated # codes and standards, # personnel trained, # audits, # state programs # of tech’s purchased by gov’t, # of materials disseminated, # of website hits Outputs Programs, CFO, OMB, Congress R&D Community, Industry Programs, partners R&D community Relevant industries Relevant markets Potential purchasers For # journal article citations # of potentially commercializ-able technologies # of innovative or advanced commercial products with improved cost & performance # of recommenda-tions for using advanced commercial products and practices # and % of advanced commercial products by adoption stage Outcomes # of technology spinoffs Energy saved (quad. Btu), GW of add’l RE capacity, Expenditure savings ($) Carbon saved (mmtce) Each box in the logic model is a potential measurement area
Performance targets may also be developed for each box in the logic model External Influences Cost and performance of competing technologies (varies by technology) Oil prices ($/barrel) NG prices ($/tcf) Electricity prices (c/kWh) Coal prices ($/ton) GDP (billion 1996 $) RE production tax credit (c/kWh) EE/RE tax credits ($) CAFÉ standards (mpg) Vehicle & power plant emission standards (varies by pollutant) Federal funding (millions of nominal $) Federal personnel (FTEs) Private funding (millions of nominal $) # of RD&D facilities Inputs Program planning & assessment Develop & maintain program infrastructure Conduct research Develop technology Demonstrate technology Developing government & market infrastructure Deploy technology Activities Feedback Loops % programs w/benefit estimates % program w/program plans # of partnerships # of journal articles # of presentations # prototypes -initial -intermediate -commercial Prototype cost & performance # and % of commercial- scale technologies validated # codes and standards, # personnel trained, # audits, # state programs # of tech’s purchased by gov’t, # of materials disseminated, # of website hits Outputs Programs, CFO, OMB, Congress R&D Community, Industry Programs, partners R&D community Relevant industries Relevant markets Potential purchasers For # journal article citations # of potentially commercializ-able technologies # of innovative or advanced commercial products with improved cost & performance # of recommenda-tions for using advanced commercial products and practices # and % of advanced commercial products by adoption stage Outcomes # of technology spinoffs Energy saved (quad. Btu), GW of add’l RE capacity, Expenditure savings ($) Carbon saved (mmtce)
Arrows between the boxes help identify evaluation questions Evaluation Questions: Demonstrate technology Activities • Has EERE engaged the right partners in tests and done it efficiently? Test, improve, & validate commercial- scale technology, Give industry hands-on experience • Have relevant industries gained hands-on experience with the technologies? Outputs • Has industry experience lead to investment in these innovative or advanced commercial energy products? Relevant industries For Investment by industry in innovative or advanced commercial products • Have EERE’s efforts to test and demonstrate energy technologies led to validated commercial scale technologies? (Activities to outcomes) Outcomes
Potential management / evaluation questions for EERE ask if strategies are working • Have program planning and assessment activities increased potential program benefits per federal dollar spent? • Has developing and maintaining EERE program infrastructure provided the scientific and technical expertise and facilities required to carryout program activities? • Has research conducted by EERE yielded energy-related concepts and designs with possible commercial applications?
Management / evaluation questions (cont.) • Has EERE technology development yielded potentially commercializable energy technologies? • Have EERE efforts to test and demonstrate energy technologies led to investment by industry in these innovative or advanced commercial energy products? • Have EERE efforts to develop government and business infrastructures led to favorable policies and capable delivery channels for EERE products and practices?
Management / evaluation questions (cont.) • Have EERE deployment activities with end users increased the awareness, appreciation, and adoption of EERE products and practices? And, altogether has the EERE portfolio of RDD& D programs led to adoption of EERE products and practices and yielded economic, security, and environmental benefits that would not have occurred otherwise?
External Influences Cost and performance of competing technologies (varies by technology) Oil prices ($/barrel) NG prices ($/tcf) Electricity prices (c/kWh) Coal prices ($/ton) GDP (billion 1996 $) RE production tax credit (c/kWh) EE/RE tax credits ($) CAFÉ standards (mpg) Vehicle & power plant emission standards (varies by pollutant) Federal funding (millions of nominal $) Federal personnel (FTEs) Private funding (millions of nominal $) # of RD&D facilities Inputs Program planning & assessment Develop & maintain program infrastructure Conduct research Develop technology Demonstrate technology Developing government & market infrastructure Deploy technology Activities Feedback Loops % programs w/benefit estimates % program w/program plans # of partnerships # of journal articles # of presentations # prototypes -initial -intermediate -commercial Prototype cost & performance # and % of commercial- scale technologies validated # codes and standards, # personnel trained, # audits, # state programs # of tech’s purchased by gov’t, # of materials disseminated, # of website hits Outputs Programs, CFO, OMB, Congress R&D Community, Industry Programs, partners R&D community Relevant industries Relevant markets Potential purchasers For # journal article citations # of potentially commercializ-able technologies # of innovative or advanced commercial products with improved cost & performance # of recommenda-tions for using advanced commercial products and practices # and % of advanced commercial products by adoption stage Outcomes # of technology spinoffs Energy saved (quad. Btu), GW of add’l RE capacity, Expenditure savings ($) Carbon saved (mmtce) Evaluations can explain why some goals were met and others were not (3) But, competing technologies improved more than expected (1) Funding was about what was expected (4) Energy prices were lower than expected (2) R&D yielded expected results (5) Thus, market penetration was slower than expected (6) And benefits were lower than expected
External Influences Federal, state & local government funding Private funding, Personnel, Facilities, Past R&D results Political environment Quality of R&D proposals Unpredictable nature of R&D Cost and performance of competing technologies Industry willingness to take risk Energy prices State of the economy Government policies and regulations Inputs Program planning & assessment Develop & maintain program infrastructure Conduct research Develop technology Demonstrate technology Developing government & market infrastructure Deploy technology Activities Feedback Loops Benefit estimates, Priorities identified, Budget requests, Program plans Public & private labs and test beds, Knowledge bases, Trained S&T personnel, Partnerships New knowledge, proof of concepts as represented by data, publications Technology prototypes -initial -intermediate -commercial Performance analysis Test, improve, & validate commercial- scale technology, Give industry hands-on experience Codes and standards, Trained personnel, Audits tools, State programs Government purchases, Information disseminated, Early seeding of technologies Outputs Programs, CFO, OMB, Congress R&D Community, Industry Programs, partners R&D community Relevant industries Relevant markets Potential purchasers For Program funding in appropriate areas; Efficiency, Fiscal responsibility Relevant S&T expertise, capabilities and facilities to deliver programs Concepts & designs with possible applications, Knowledge spill-over Potentially commercializ-able technologies to replace existing or fill a system need Investment by industry in innovative or advanced commercial products Favorable policies, capable delivery channels for EERE products Widespread adoption of EERE products; More productive use of energy Outcomes National R&D capabilities, including options if circumstances change Spin-off products and their associated benefits New products & businesses Economic, security, and environmental benefits Technology leadership In summary, logic models for RDD&D programs help identify…
… and tell the performance story External Influences Federal, state & local government funding Private funding, Personnel, Facilities, Past R&D results Political environment Quality of R&D proposals Unpredictable nature of R&D Cost and performance of competing technologies Industry willingness to take risk Energy prices State of the economy Government policies and regulations Inputs Program planning & assessment Develop & maintain program infrastructure Conduct research Develop technology Demonstrate technology Developing government & market infrastructure Deploy technology Activities Feedback Loops Benefit estimates, Priorities identified, Budget requests, Program plans Public & private labs and test beds, Knowledge bases, Trained S&T personnel, Partnerships New knowledge, proof of concepts as represented by data, publications Technology prototypes -initial -intermediate -commercial Performance analysis Test, improve, & validate commercial- scale technology, Give industry hands-on experience Codes and standards, Trained personnel, Audits tools, State programs Government purchases, Information disseminated, Early seeding of technologies Outputs Programs, CFO, OMB, Congress R&D Community, Industry Programs, partners R&D community Relevant industries Relevant markets Potential purchasers For Program funding in appropriate areas; Efficiency, Fiscal responsibility Relevant S&T expertise, capabilities and facilities to deliver programs Concepts & designs with possible applications, Knowledge spill-over Potentially commercializ-able technologies to replace existing or fill a system need Investment by industry in innovative or advanced commercial products Favorable policies, capable delivery channels for EERE products Widespread adoption of EERE products; More productive use of energy Outcomes National R&D capabilities, including options if circumstances change Spin-off products and their associated benefits New products & businesses Economic, security, and environmental benefits Technology leadership
For more information contact: Gretchen Jordan Sandia National Laboratories 950 L'Enfant Plaza, SW Suite 110 Washington, DC 20024-2123 Phone: (202) 314-3040 Email: gbjorda@sandia.gov John Mortensen: jmort@prodigy.net John Reed: jreed@innovologie.com George Teather: gteather@sympatico.ca