Download
1 / 12
120 likes | 288 Views
Glacier atmosphere interactions and hydrology: Peyto field experiment discoveries. D. Scott Munro University of Toronto. base (2240 m) +. AWS Network. low (2183 m) +. ← Point process investigation: glacier atmosphere interactions and hydrology

E N D
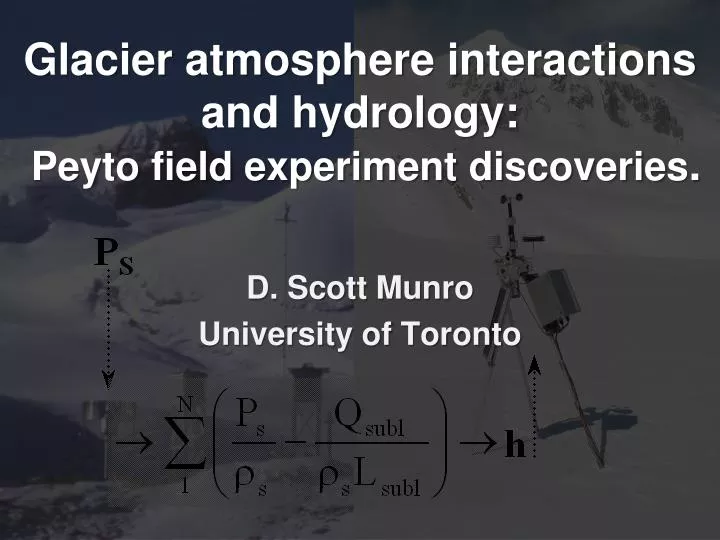
Glacier atmosphere interactions and hydrology: Peyto field experiment discoveries. D. Scott Munro University of Toronto
base (2240 m) + AWS Network low (2183 m) + • ← Point process investigation: glacier atmosphere interactions and hydrology • ← Distribution tools (DEM, trigonometry, parameterization) • ← Distributed modelling and prediction • ← Base AWS/RCM forcing middle (2461 m) + high (2709 m) +
Snow reservoir Ice reservoir Snow accumulation Ice & Snow melt qj
Hydrology K~1.5 h K~10.5 h
Mϋller & Keeler 1969 K~11.25 h, ice; 100 h, snow
Glacier – Atmosphere Interaction • Focusing on the sensible heat flux, QH, there are respectively to the right of the equal sign the gradient, eddy correlation (EC) and bulk transfer methods of obtaining the flux density: • The key feature of the flow regime is a local wind speed maximum, close to the surface, through which heat should not flow because Du/Dz = 0, yet the bulk transfer approach seems to provide reasonable heat flux values, regardless of the measurement height used. • Although EC measurements of QH below the local wind speed maximum seem to agree with bulk transfer estimates, less is known about EC measurements near to and above the level of maximum wind speed. •Also to consider is the Oerlemans-Grisogono parameterization (OG) ......which is convenient for modelling, but contrary to classical thinking...........about the nature of the glacier atmospheric boundary-layer. wind temperature • If classical thinking is correct EC measurements of QH→ 0 near the .....local wind speed maximum, but if OG is correct the QH measurements .....will show a step change across the level of maximum wind speed. wind
Regional Wind ? Experiment objectives: A: B-L turbulent flow field, 1-6 m B to A: B-L acceleration & cooling 6 m 4 m 2 m 1 m 6 m 4 m 2 m 1 m B Glacier Wind A Mobile EC Fixed EC ~50 m ~ 650 m
Turbulent flow field, 1-6 m Regional Wind Glacier Wind
Acceleration & cooling Taking mean values, assuming no heat transfer across 4 m and correcting for adiabatic warming, expect 1 & 2 m TA< TB by ~2 °C.
Concluding with analogues: On hydrology: • An electrical analogue to consider for supraglacial runoff is a series resistance system that links the runoffpotential of the melting ice surface to supraglacial stream discharge. • In such a system resistance should increase with weathering crust development, decrease with decay, so a good test of this idea is to continuously measure short-term runoff from a supraglacial basin all summer to see if K depends on the weather. On glacier-atmosphere interactions: • An electrical analogue to consider for boundary-layer heat transfer to the glacier is a parallel resistance system that links the energy potential of the regional air mass to surface melt. • One branch of such a system is the geostrophic flow, the other akatabatic flow that is subject to sporadic breakdown, thus explaining hot flashbehaviour. • This is supported by the 2008 eddy correlation data that suggest two turbulent transfer fields adjacent to the glacier surface, one of which extends above the level of the wind speed maximum.
Acknowledgements CFCAS → IP3 Network Funding Environment Canada → CRYSYS Program NSERC → Discovery Grants Natural Resources Canada → GSC-CGVMAN University of Toronto Mississauga