Download
1 / 40
400 likes | 565 Views
靜宜大學 生態研究所 碩士班. Threats to biodiversity ( 對生物多樣性的威脅 ). 鄭先祐 (Ayo) 國立 臺南大學 環境與生態學院 生態科學與技術學系 教授. Japalura@hotmail.com. Threats to biodiversity. Major threats to biodiversity and their interaction Anthropogenic extinctions and their community and ecosystem impacts

E N D
靜宜大學 生態研究所 碩士班 Threats to biodiversity(對生物多樣性的威脅) 鄭先祐(Ayo) 國立 臺南大學 環境與生態學院 生態科學與技術學系 教授 Japalura@hotmail.com
Threats to biodiversity • Major threats to biodiversity and their interaction • Anthropogenic extinctions and their community and ecosystem impacts • Current patterns of global endangerment • What types of species are most vulnerable to extinction? • Responses to the biodiversity crisis
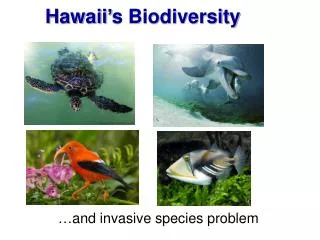
Major threats to biodiversity • Habitat degradation (棲地的潰敗) • Overexploitation (過度的開發) • Invasive species (入侵物種) • Anthropogenic climate change (人為導致的氣候變遷) • Bioaccumulation and Synergistic effects(生物累積和加乘效應) • Snowballing (滾雪球) effect
Indirect impacts • Cascade effects (Box. 31.1) • Ecological release • Dominant species • Ecosystem engineers, those species such as beavers or elephants that strongly modify habitat. • Keystone species
Current patterns of global endangerment • Table 3.2 number of globally threatened species by taxon. • Box 3.2 the IUCN red list system. • IUCN = The International Union for the Conservation of Nature and Natural Resources.(自然和自然資源的保育)
Box 3.2 The IUCN red list system • Extinct (Ex): • A taxon is extinct when there is no reasonable doubt that the last individual has died. • A taxon is presumed extinct when exhaustive surveys in known and expected habitat, at appropriate times (diurnal, seasonal, annual) to the taxon’s life cycle and life form, throughout its historic range have failed to record an individual.
Box 3.2 The IUCN red list system • Extinct in the wild (EW): • A taxon is extinct in the wild when it is known only to survive in cultivation, in captivity, • or as a naturalized population well outside the past range, and there is no reasonable doubt that the last individual in the wild has dies, as outlined under EX.
Box 3.2 The IUCN red list system • Threatened (Table A) • Critically Endangered (CR) (Table A) • Endangered (EN) (Table A) • Vulnerable (VU) (Table A) • Near threatened (NT) • A taxon is near threatened when it is likely to qualify for a threatened category I the near future. • Least Concern (LC) • It is not likely to qualify in the near future.
Box 3.2 The IUCN red list system • Data deficient (DD) • A taxon is data deficient when there is inadequate information to make a direct or indirect assessment of its risk of extinction based on its distribution, population status, or both. • Not evaluated (NE) • A taxon in not evaluated if it is has not yet been evaluated against the criteria.
Table A overview of criteria (A-E) for classify species as CR, EN, or VU • A-1 Reduction in population size (over 10 years or 3 generations in the past where causes are reversible, understood, and have ceased) >90% >70% >50% • A-2 Reduction in population size (where causes are not reversible, not understood, or ongoing) >80% >50% >30% • B-1 Small range (extent of occurrence) plus any two of (a) severe fragmentation or few occurrence (CR=1, EN=2-5, VU=6-10), (b) continuing decline, (c) extreme fluctuation. <100 km2 <5000 km2 <20,000 km2 • B-2 small range <10 km2 < 500 km2 < 20,000 km2
Table A overview of criteria (A-E) for classify species as CR, EN, or VU • C Small and declining population. (Mature individuals, plus continuing decline either over a specific rate in short time periods, or with specific population structure or extreme fluctuations.) <250 <2500 <10,000 • D-1 very small population (mature individuals) <50 <250 <1,000 • D-2 very small range (Capable of becoming CR or EX within a very short time) - - <20 km2 or <5 locations • E Quantitative analysis (estimated extinction risk using quantitative models, e.g., Population viability analyses.
Essay 3.3 An endangered biological phenomenon • endangered biological phenomenon • 肇致物種危機,不是單純的物種本身的適應能力,而是物種的生活習性(現象)。 • 譬如,migrant species • There are two principal reasons why animal migrations are endangered by human activities • Migrant species move through a sequence of ecologically distinct areas. • Aggregation of the migrants can occur, making the animals especially vulnerable.
Fig. 3.6 Habitat loss and degradation is the greatest threat to global diversity among mammals, birds, amphibians, and gymnosperms.
Endangered species in the US Table 3.3 percent of US threaten and endangered species affected by five types of threat. • Habitat loss and degradation • 89%(M)、90%(B)、97%(R)、87%(A)、94%(F) • Overexploitation • 45%(M)、33%(B)、66%(R)、17%(A)、13%(F) • Invasive species • 27%(M)、69%(B)、37%(R)、27%(A)、53%(F) • Pollution • 19%(M)、22%(B)、53%(R)、45%(A)、66%(F) • Disease • 8%(M)、37%(B)、8%(R)、5%(A)、1%(F)
Fig. 3.8 Proportion of species threatened with extinction by plant and animal groups in the US.
Freshwater mussels (淡水貝) 70% Crayfishes(淡水螯蝦) 50% Stoneflies 43% Freshwater fishes 38% Amphibians 37% Mammals 15% Birds 14% Flowering plants 35% Gymnosperms 25% Ferns 24% Tiger beetles, butterflies, skippers, reptiles, dragonflies 18% Fig. 3.8 Proportion of species threatened with extinction by plant and animal groups in the US.
Ecuador 2,151 spp. US 1,143 spp. Malaysia 892 spp. Indonesia 833 spp. China 773 spp. Mexico 748 spp. Brazil 697 spp. Australia 621 spp. Colombia 593 spp. India 552 spp. Madagascar 530 spp. Numbers of threatened species in 12 countries(Table 3.4, p.84)
Fig. 3.9 Contribution of major threats to endangerment among vertebrate species in China. • Overexploitation 79% vertebrate species affected • Habitat loss 70% • Pollution 20% • Alien species 5% • Disease 1%
What types of species are most vulnerable to extinction? • Specialization • K-selected life history strategy • Rare species • Highly restricted geographic range • Seven forms of species rarity, based on three distributional traits (Table 3.5, p.87) • Population size, geographic range, habitat specificity.
“bad luck”: extrinsic causes of extinction due to human activities • These species are not intrinsically vulnerable due to their traits but rather have the misfortune to be in the wrong place, the wrong time, or of being particularly palatable to humans.
Economic and social contexts of endangerment • Extreme poverty afflicts over 1 billion people, who live on less than $1/day, are chronically hungry, lack clean water and sanitation. • An additional 2.7 billion live on scarcely $2/day, and are just able to meet their basic needs, but not more. • Globalization spreads the dangers of economic expansion as countries prioritize international trade in natural resources to enhance their economies. • This can exacerbate poverty where trade is not tied to sustainable practices that improve the lives of local people, but rather provide cheap goods that fuel the economies of developed nations.
Responses to the biodiversity crisis • Scientific analysis of and communication about the drivers of change in biodiversity and human welfare • Technological improvements • Legal and institutional instruments • Economic incentives and plans • Social interventions.
The mechanisms for achieving solutions • Establishment of protected. • Targeted interventions at genetic, species, and ecosystem levels that integrate ecological understanding with community-based problem solving. • Restoration of damage ecosystems or endangered populations. • Creation of truly sustainable forms of development.
Laws and international agreements that address biodiversity loss • Major international agreements, the landmark US Endangered species Act (ESA), and other key US laws that protect biodiversity are described in Case Study 3.3. • Red List index (RLI) tallies changes in status due to either a deterioration or improvement of all threatened and near-threatened species since 1988. • The RLI for birds has decreased by nearly 7% since 1988, (Fig.3.10, p.91) • Living Planet Index (LPI), summarizes change over time in populations of over 1100 terrestrial, freshwater, and marine vertebrate species (Loh, et al., 2005) • The LPI shows that terrestrial vertebrates have declined by 25% between 1970 and 2000 (Fig. 3.11A)
Case study 3.1 Enigmatic declines and disappearances of amphibian populations • Ultraviolet radiation • Disease pathogens • Introduced species • Natural population fluctuations • Climate change • Subtle habitat changes
Case study 3.2 hope for a hotspot: preventing an extinction crisis in Madagascar • Madagascar as a biodiversity hotspot • Hotspot under siege (侵襲) • Promise for protected area expansion • Maximizing protected area design for biodiversity conservation • From planning to park establishment: the case of Masoala • Continuing the legacy(遺產): sustainability and financing of a new reserve system • Protected areas: providing promise for Madagascar
Questions for discussion • Despite considerable efforts, we know very little about the status of most of the world’s species. How can we improve our knowledge on species endangerment? What kinds of information might be most helpful to garner(獲得), and why? • In two or three decades’ time, your children or other youngsters may ask you a question along the lines of “when the biodiversity crisis became apparent in its full scope during the 1990s and 2000s, what did you do about it?” What will your answer be?
問題與討論 Japalura@hotmail.com • Ayo 台南 NUTN 站http://myweb.nutn.edu.tw/~hycheng/