Download
1 / 19
210 likes | 439 Views
Modeling Cross-contamination in Quantitative Microbial Risk Assessment. Don Schaffner Food Risk Analysis Initiative Rutgers University. The Achilles heel of risk assessment - G. Paoli 7/24/02. Modeling Cross-contamination in Quantitative Microbial Risk Assessment.

E N D
Modeling Cross-contamination in Quantitative Microbial Risk Assessment Don SchaffnerFood Risk Analysis Initiative Rutgers University 1st International Conference on Microbial Risk Assessment: Foodborne Hazards, College Park MD, July 2002
The Achilles heel of risk assessment - G. Paoli 7/24/02 Modeling Cross-contamination in Quantitative Microbial Risk Assessment Don SchaffnerFood Risk Analysis Initiative Rutgers University 1st International Conference on Microbial Risk Assessment: Foodborne Hazards, College Park MD, July 2002
Laboratory Experiments • Nalidixic acid resistant Enterobacter aerogenes with attachment characteristics similar to Salmonella • More than 30 participants dice inoculated chicken, wash hands and/or wear gloves, slice lettuce • Sample hands, foods, faucet spigots cutting boards for Enterobacter 1st International Conference on Microbial Risk Assessment: Foodborne Hazards, College Park MD, July 2002
Why these studies ? • Practical consideration • A company was interested in showing efficacy of a touch-free faucet… they provided funding! • Our research philosophy • Variability matters, especially for modeling and risk assessment 1st International Conference on Microbial Risk Assessment: Foodborne Hazards, College Park MD, July 2002
Things to think about… • A surface can either … • be sampled or • be used to contaminate another surface • Relative numbers and rates • Dirty hands -> clean faucet handles • Dirty hands <-> dirty faucet handles • Clean hands <- dirty faucet handles • How many observations at one set of conditions are needed? 1st International Conference on Microbial Risk Assessment: Foodborne Hazards, College Park MD, July 2002
Data Analysis • Log transformation of % transfer • Frequency histogram in Excel • Best distribution using BestFit • Normal distributions fit the data 1st International Conference on Microbial Risk Assessment: Foodborne Hazards, College Park MD, July 2002
Think about data transformation… 1st International Conference on Microbial Risk Assessment: Foodborne Hazards, College Park MD, July 2002
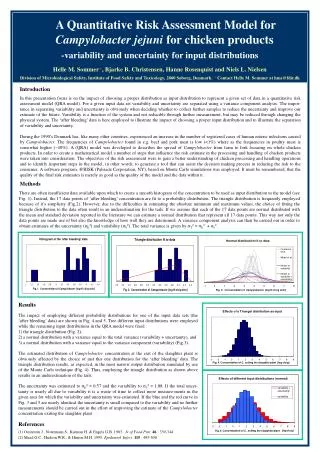
Cross contamination results 1st International Conference on Microbial Risk Assessment: Foodborne Hazards, College Park MD, July 2002
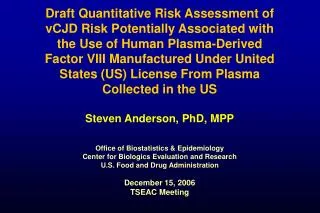
Glove barrier: Chicken to hand 1st International Conference on Microbial Risk Assessment: Foodborne Hazards, College Park MD, July 2002
Our Published Work • Chen, Y., Jackson, K.M. Chea, F.P. and Schaffner, D.W. 2001. Quantification and variability analysis of bacterial cross-contamination rates in the kitchen. Journal of Food Protection. 64(1):72-80. • Montville, R., Chen, Y., and Schaffner, D.W. 2001. Glove barriers to bacterial cross-contamination. Journal of Food Protection. 64(6), 845–849. • Montville, R., Chen, Y. and Schaffner, D.W., 2002. Risk assessment of handwashing efficacy using literature and experimental data. International Journal of Food Microbiology 73(2-3), 305-313. 1st International Conference on Microbial Risk Assessment: Foodborne Hazards, College Park MD, July 2002
Currently ongoing research with application on microbial behavior in the kitchen environment 1st International Conference on Microbial Risk Assessment: Foodborne Hazards, College Park MD, July 2002
Other recent publications • L. L. Gibson, J. B. Rose, C. N. Haas, C. P. Gerba, and P. A. Rusin. Quantitative assessment of risk reduction from hand washing with antibacterial soaps. J.Appl.Microbiol. 92:136S-143S, 2002. • “The objective of this study was to examine the risk reduction achieved from using different soap formulations after diaper changing using a microbial quantitative risk assessment approach.” • T. A. Cogan, J. Slader, S. F. Bloomfield, and T. J. Humphrey. Achieving hygiene in the domestic kitchen: the effectiveness of commonly used cleaning procedures. J.Appl.Microbiol. 92 (5):885-892, 2002. • “Aims: To quantify the transmission of Salmonella and Campylobacter to hands, cloths, and hand- and food-contact surfaces during the preparation of raw poultry in domestic kitchens, and to examine the impact on numbers of these bacteria of detergent-based cleaning alone, or in conjunction with thorough rising.” 1st International Conference on Microbial Risk Assessment: Foodborne Hazards, College Park MD, July 2002
Things to consider in QMRA • Cross-contamination must be handled differently than other increases • Two log increase due to growth: 1 + 2 = 3 • 100 CFU added from cross-contamination: 10 + 100 = 110 • Modeling the non-linear nature of the process 1st International Conference on Microbial Risk Assessment: Foodborne Hazards, College Park MD, July 2002
Non-linear process 1st International Conference on Microbial Risk Assessment: Foodborne Hazards, College Park MD, July 2002
Model interface 1st International Conference on Microbial Risk Assessment: Foodborne Hazards, College Park MD, July 2002
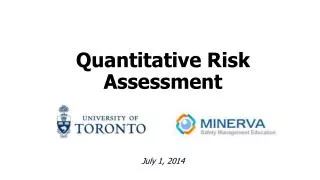
initial: 1000 storage increase: 1 cooking decrease: 5 log cross contamination rate mean: -1 (10%) log cross contamination standard deviation: 1 High Rate Results 1st International Conference on Microbial Risk Assessment: Foodborne Hazards, College Park MD, July 2002
Low Rate Results initial: 1000 storage increase: 1 cooking decrease: 5 log cross contamination rate mean: -3 (0.1%) log cross contamination standard deviation: 1 1st International Conference on Microbial Risk Assessment: Foodborne Hazards, College Park MD, July 2002
Where to we go from here? • What factors are important in controlling transfer rate? • Soil type, organism, pressure, concentration, etc. • What routes are important? • Hand to mouth, cutting board to raw product, etc. • What behaviors are important? • Handwashing, cleaning frequency, etc. • Once we know what’s important, we can ignore what’s not important, and include a useful, simplified cross contamination module in our risk assessments 1st International Conference on Microbial Risk Assessment: Foodborne Hazards, College Park MD, July 2002
Acknowledgements • Lee Budd for stimulating discussions • Sloan Valve company for support and funding • The Food Risk Analysis Initiative was funded in part by the New Jersey Agricultural Experiment Station • Members of the FoRAI team: Yuhuan Chen, Rebecca Montville, Kristin Jackson, Siobain Duffy, Purvi Vora, Lihui Zhao 1st International Conference on Microbial Risk Assessment: Foodborne Hazards, College Park MD, July 2002