Download
1 / 9
90 likes | 253 Views
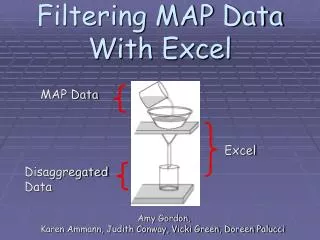
Filtering MAP Data With Excel . MAP Data. Amy Gordon, Karen Ammann, Judith Conway, Vicki Green, Doreen Palucci. Excel. Disaggregated Data. Objectives. Participants will: Review how to order and retrieve reports Unzip downloaded files Format an Excel spreadsheet

E N D
Filtering MAP Data With Excel MAP Data Amy Gordon, Karen Ammann, Judith Conway, Vicki Green, Doreen Palucci Excel Disaggregated Data
Objectives • Participants will: • Review how to order and retrieve reports • Unzip downloaded files • Format an Excel spreadsheet • Disaggregate data by filtering
Essential Question How would using Excel to disaggregate data be beneficial in making data-driven decisions?
Warm Up – Do Now First Things First: Review… • Reports need to be ordered and retrieved from the NWEA website • Reports need to be unzipped and saved in a folder
Text to Excel • Open with Excel • Format / Freeze / Filter
Guided Practice • Be sure you have logged in as yourself • Make a folder in your MY DOCUMENTS folder called NWEA Fall 2005 • Insert and open CD • Drag the January 12 folder to the new NWEA Fall 2005 folder
Guided Practice • UNZIP: • Right click on the zipped folder • Select EXTRACT ALL • Continue clicking NEXT and then FINISH • The new unzipped folder automatically opens
Independent Practice • Format the spreadsheet: • Bold header row • Increase width of columns • Freeze pane • Filter for the following: • 6th grade male students • Hispanic • In mathematics • Who scored above the 50th percentile
CLOSURE • Essential Question Discussed: • How would using Excel to disaggregate data be beneficial in making data-driven decisions? • Are there any questions that this filtering exercise did not answer?