Download
1 / 23
230 likes | 338 Views
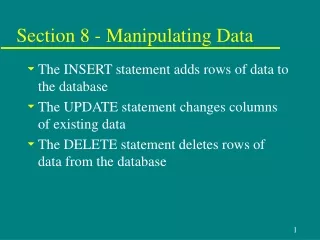
Manipulating Data With Excel. Sorting and Filtering. SORTING DATA. To sort the RIT Perfomance alpabetically, click on Data - Sort. Sort by click on RIT Perf. Then click on Studentlastname. Click OK. Your data is sorted by RIT Performance and Last Name. FILTERING.

E N D
Manipulating Data With Excel Sorting and Filtering MCSC Technology Training, October 2002
SORTING DATA To sort the RIT Perfomance alpabetically, click on Data - Sort MCSC Technology Training, October 2002
Sort by click on RIT Perf MCSC Technology Training, October 2002
Then click on Studentlastname MCSC Technology Training, October 2002
Click OK MCSC Technology Training, October 2002
Your data is sorted by RIT Performance and Last Name MCSC Technology Training, October 2002
FILTERING MCSC Technology Training, October 2002
CLICK ON ANY CELL IN ROW ONE (YOUR FIELD NAME ROW) MCSC Technology Training, October 2002
CLICK DATA – FILTER - AUTOFILTER MCSC Technology Training, October 2002
DOWN ARROWS APPEAR IN EACH CELL IN ROW ONE MCSC Technology Training, October 2002
LET’S SAY YOU WANT TO SEE JUST THE LOW SCORES UNDER RIT PERFORMANCE. CLICK THE DOWN ARROW IN THE RIT PERF. FIELD. SELECT LO MCSC Technology Training, October 2002
ONLY THE LOW SCORES ARE SHOWN. MCSC Technology Training, October 2002
TO SEE ALL YOUR DATA, CLICK ON DATA – FILTER – SHOW ALL. MCSC Technology Training, October 2002
CREATING PIVOT TABLES MCSC Technology Training, October 2002
CLICK ON DATA – PIVOT TABLE AND PIVOT CHART REPORT MCSC Technology Training, October 2002
CLICK NEXT MCSC Technology Training, October 2002
BY DEFAULT THE PROGRAM WILL SELECT ALL YOUR DATA. CLICK NEXT MCSC Technology Training, October 2002
CLICK LAYOUT MCSC Technology Training, October 2002
DRAG GRADENAME TO ROW DRAG RIT PERF TO BOTH COLUMNand DATA CLICK OK MCSC Technology Training, October 2002
PLACE THE TABLE IN A NEW WORKSHEET (BY DEFAULT). CLICK FINISH MCSC Technology Training, October 2002
YOUR PIVOT TABLE HAS CONVERTED THE TEXT DATA (RIT PERF) TO NUMERICAL DATA. CLICK ON ANY OF THE NUMBERS TO SEE THE SPECIFIC DATA. Make changes to your pivot table by clicking on the Pivot Table Wizard icon MCSC Technology Training, October 2002
QUESTIONS? Call Ray at 5385 or E-mail me at rdhamilt@mvsc.k12.in.us MCSC Technology Training, October 2002