Download
1 / 27
270 likes | 277 Views
This planner includes practice exercises and enrichment activities to help students name coordinates and quadrants, graph points, and analyze scatter plots in the coordinate plane.

E N D
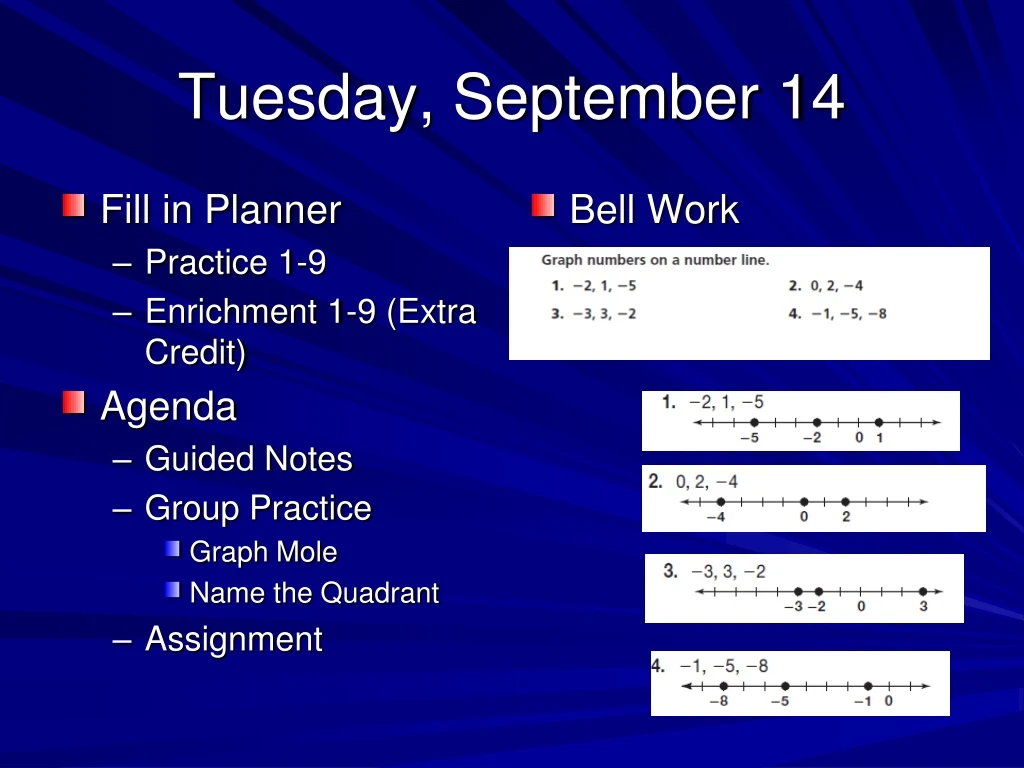
Tuesday, September 14 • Fill in Planner • Practice 1-9 • Enrichment 1-9 (Extra Credit) • Agenda • Guided Notes • Group Practice • Graph Mole • Name the Quadrant • Assignment Bell Work
Objective(s) • SWBAT • name coordinates and quadrants in the coordinate plane • graph points in the coordinate plane • analyze scatter plots
Vocabulary • A coordinate plane is formed by the intersection of two number lines.
Vocabulary • The x axis is the horizontal number line
Vocabulary • The y axis is the vertical number line
Vocabulary • Quadrants are the four (I, II, III, and IV) parts of the coordinate plane. I II I III IV
Vocabulary • The origin is where the axes intersect (0,0)
Vocabulary • An ordered pair gives the coordinates of a point. The x-coordinate is named first and then the y-coordinate. (x,y) (3,2)
Vocabulary • An x coordinate shows the position to the right or left of the origin. (3,2)
Vocabulary • A y coordinate shows the position above or below the origin. (3,2)
(0,0) O is the where the axes intersect . P (-5, -4)
Point G is located units to the left of the y axis. So the x-coordinate is 2 -2 5 4 3 2 1 -5 -4 -3 -2 -1 0 1 2 3 4 5 -1 -2 G -3 -4 -5
Point G is located units below the x axis. So the y-coordinate is 3 -3 5 4 3 2 1 -5 -4 -3 -2 -1 0 1 2 3 4 5 -1 -2 G -3 -4 -5
The coordinates of point G are Point G is in Quadrant (-2,-3). III 5 4 3 2 1 -5 -4 -3 -2 -1 0 1 2 3 4 5 -1 -2 G -3 -4 -5
left Graph point M(-3,3). Step 1: Start at the origin. Step 2: Move spaces to the 3 5 4 3 2 1 -5 -4 -3 -2 -1 0 1 2 3 4 5 -1 -2 -3 -4 -5
M Step 3: Move units up. Draw a dot. Label it 3 5 4 (-3,3) 3 2 1 -5 -4 -3 -2 -1 0 1 2 3 4 5 -1 -2 -3 -4 -5
Quick Check Answers 1a. E (2,-3) F(3,3) 1b. E (IV) F (I) 2. It’s a triangle!
Vocabulary • A scatter plot is a graph that relates data of two different sets. The two sets of data are displayed as ordered pairs.
positive negative no Trend line
$63.75 6 25.50 Make a scatter plot online
increase positive
Someone worked 11 hours and made $46.75 Conrad would make about $8
Objective(s) • SWBAT • name coordinates and quadrants in the coordinate plane • graph points in the coordinate plane • analyze scatter plots