Download
1 / 16
160 likes | 273 Views
Shear Stress Sensor Using Cholesteric Crystals. Group #3 Group Members Matthew Carmichael, FSU Tyler Elsey, FSU Luiz Paes, UNIFEI Graduate Assistant Matthew Worden Sponsors Dr. Dickinson , Eglin AFRL Dr. Oates, FAMU & FSU COE 2/20/2013 eng.fsu.edu/me/senior_design/2013/team3.

E N D
Shear Stress Sensor Using Cholesteric Crystals Group #3 Group Members Matthew Carmichael, FSU Tyler Elsey, FSU Luiz Paes, UNIFEI Graduate Assistant Matthew Worden Sponsors Dr. Dickinson , Eglin AFRL Dr. Oates, FAMU & FSU COE 2/20/2013 eng.fsu.edu/me/senior_design/2013/team3
OVERVIEW • Project Scope and Objectives • Theory • Technical Approach • Final Design • Programming Needed • Schedule
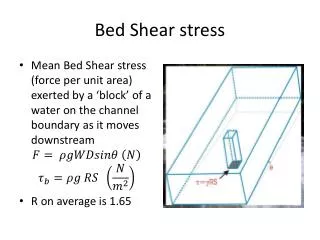
Need Statement & Project Scope • Need Statement • Need in the market for a shear stress sensor that can be used outside the lab • Project Scope • Create Testing Apparatus • Determine if cholesteric crystals are able to measure shear stress
Cholesteric Crystals • Originally discovered in cholesterol • Helical Structure • Pitch varies with the boundary conditions • i.e. electricity or forces • Liquid Crystals made easily from 3 powders • Polymer form made through many time intensive processes
Technical Approach • Assume no slip condition for liquid crystal testing • BluLoop Fiber Optic Light • Spectrometer: • 200-1100 nm • 2048 pixels • Linear Servo Motor: • 1 step = 1/64” • Load cell: • 10N
Programming • LabView • Correlation between load and voltage with load cell • Load cell, spectrometer need to start at the same time – record information • MATLAB • Create method to review time resolved data • Filter spectrum from reference spectrum • Find equation that relates load to wavelength
Simulation – FEM (Finite Element Method) Pressure - Sine Load -0.5 sin ((4π/L)*x) Pa - top 0.5 sin ((4π/L)*x) Pa - bottom y x Pressure Error – Sigma YY Stress YY (Pa) Error (Pa) Y Coordinate (m) X Coordinate (m) X Coordinate (m)
Simulation – FEM (Finite Element Method) Thin film - L=2000 (c) y x Pressure - Sine Load -0.5 sin ((4π/c)*x) Pa - top Stress YY (Pa) Y Coordinate (m) X Coordinate (m)
Simulation – FEM (Finite Element Method) Shear - Cosine Load -0.5 cos((4π/L)*x) Pa - top 0.5 cos((4π/L)*x) Pa - bottom y x Pressure Error – Sigma XY Stress XY (Pa) Error (Pa) Y Coordinate (m) X Coordinate (m) X Coordinate (m)
Simulation – FEM (Finite Element Method) Thin film - L=2000 (c) y x Shear - Cosine Load -0.5 cos ((4π/c)*x) Pa - top Stress XY (Pa) Y Coordinate (m) X Coordinate (m)
Summary • -Shear stress device measurement was fabricated • -Labview and MATLAB interface is ready for experiments • -Testing samples have been made • -Next steps • Testing and analysis • Vary testing conditions and test polymer form of Cholesteric Crystals