Download
1 / 1
10 likes | 155 Views
2.2. 1.65. Shear stress (N/m²). 1.1. coupon removal. 0.96. 0.66. 0.44. 2D Stress: 0.08. Transform: Square root. Resemblance: S17 Bray Curtis similarity. 2D Stress: 0.07. Resemblance: S17 Bray Curtis similarity. Transform: Square root.

E N D
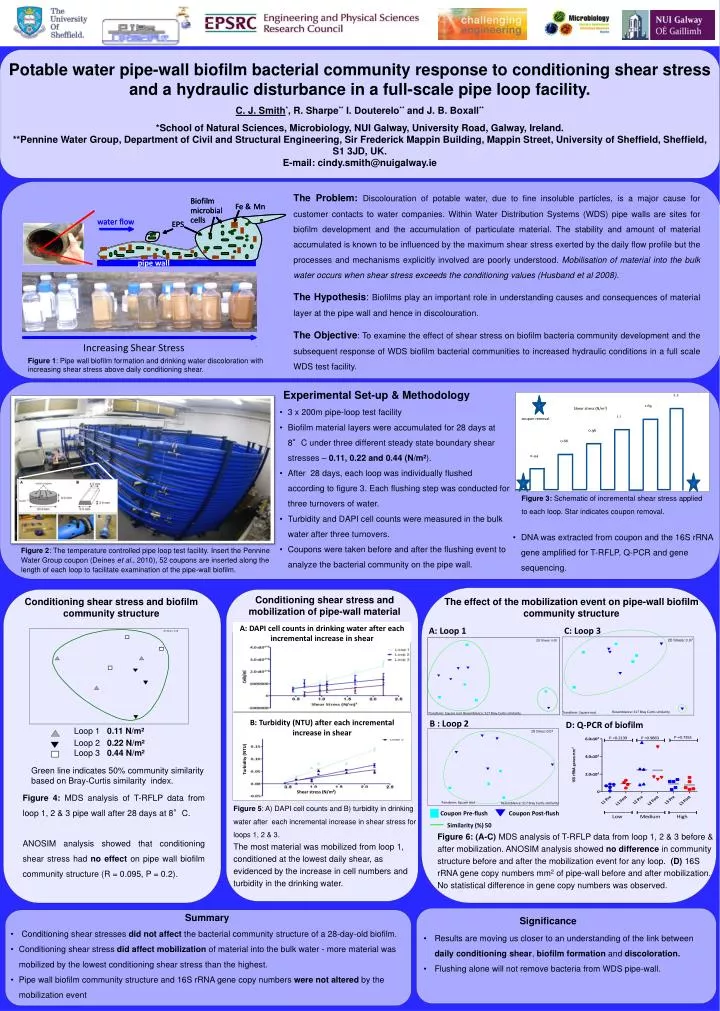
2.2 1.65 Shear stress (N/m²) 1.1 coupon removal 0.96 0.66 0.44 2D Stress: 0.08 Transform: Square root Resemblance: S17 Bray Curtis similarity 2D Stress: 0.07 Resemblance: S17 Bray Curtis similarity Transform: Square root Potable water pipe-wall biofilm bacterial community response to conditioning shear stress and a hydraulic disturbance in a full-scale pipe loop facility. C. J. Smith*, R. Sharpe** I. Douterelo** and J. B. Boxall** *School of Natural Sciences, Microbiology, NUI Galway, University Road, Galway, Ireland. **Pennine Water Group, Department of Civil and Structural Engineering, Sir Frederick Mappin Building, Mappin Street, University of Sheffield, Sheffield, S1 3JD, UK. E-mail: cindy.smith@nuigalway.ie The Problem: Discolouration of potable water, due to fine insoluble particles, is a major cause for customer contacts to water companies. Within Water Distribution Systems (WDS) pipe walls are sites for biofilm development and the accumulation of particulate material. The stability and amount of material accumulated is known to be influenced by the maximum shear stress exerted by the daily flow profile but the processes and mechanisms explicitly involved are poorly understood. Mobilisation of material into the bulk water occurs when shear stress exceeds the conditioning values (Husband et al 2008). The Hypothesis: Biofilms play an important role in understanding causes and consequences of material layer at the pipe wall and hence in discolouration. The Objective: To examine the effect of shear stress on biofilm bacteria community development and the subsequent response of WDS biofilm bacterial communities to increased hydraulic conditions in a full scale WDS test facility. Biofilm Biofilm Fe & Fe & Mn Mn microbial microbial cells cells water flow water flow EPS EPS pipe wall pipe wall Increasing Shear Stress . Figure 1: Pipe wall biofilm formation and drinking water discoloration with increasing shear stress above daily conditioning shear. Experimental Set-up & Methodology • 3 x 200m pipe-loop test facility • Biofilm material layers were accumulated for 28 days at 8°C under three different steady state boundary shear stresses – 0.11, 0.22 and 0.44 (N/m²). • After 28 days, each loop was individually flushed according to figure 3. Each flushing step was conducted for three turnovers of water. • Turbidity and DAPI cell counts were measured in the bulk water after three turnovers. • Coupons were taken before and after the flushing event to analyze the bacterial community on the pipe wall. Figure 3: Schematic of incremental shear stress applied to each loop. Star indicates coupon removal. • DNA was extracted from coupon and the 16S rRNA gene amplified for T-RFLP, Q-PCR and gene sequencing. Figure 2: The temperature controlled pipe loop test facility. Insert the Pennine Water Group coupon (Deineset al., 2010), 52 coupons are inserted along the length of each loop to facilitate examination of the pipe-wall biofilm. 2D Stress: 0.08 Conditioning shear stress and mobilization of pipe-wall material Conditioning shear stress and biofilm community structure The effect of the mobilization event on pipe-wall biofilm community structure A: Loop 1 C: Loop 3 A: DAPI cell counts in drinking water after each incremental increase in shear • Loop 1 0.11 N/m² • Loop 2 0.22 N/m² • Loop 3 0.44 N/m² B: Turbidity (NTU) after each incremental increase in shear B : Loop 2 D: Q-PCR of biofilm Figure 4: MDS analysis of T-RFLP data from loop 1, 2 & 3 pipe wall after 28 days at 8°C. ANOSIM analysis showed that conditioning shear stress had no effect on pipe wall biofilm community structure (R = 0.095, P = 0.2). 2D Stress: 0.07 Green line indicates 50% community similarity based on Bray-Curtis similarity index. Figure 5: A) DAPI cell counts and B) turbidity in drinking water after each incremental increase in shear stress for loops 1, 2 & 3. The most material was mobilized from loop 1, conditioned at the lowest daily shear, as evidenced by the increase in cell numbers and turbidity in the drinking water. Transform: Square root Resemblance: S17 Bray Curtis similarity Coupon Pre-flush Coupon Post-flush Turbidity (NTU) Similarity (%) 50 Figure 6:(A-C) MDS analysis of T-RFLP data from loop 1, 2 & 3 before & after mobilization. ANOSIM analysis showed no difference in community structure before and after the mobilization event for any loop.(D) 16S rRNA gene copy numbers mm2 of pipe-wall before and after mobilization. No statistical difference in gene copy numbers was observed. Shear stress (N/m2) • Summary • Conditioning shear stresses did not affect the bacterial community structure of a 28-day-old biofilm. • Conditioning shear stress did affect mobilization of material into the bulk water - more material was mobilized by the lowest conditioning shear stress than the highest. • Pipe wall biofilm community structure and 16S rRNA gene copy numbers were not altered by the mobilization event Significance • Results are moving us closer to an understanding of the link between daily conditioning shear, biofilm formation and discoloration. • Flushing alone will not remove bacteria from WDS pipe-wall.


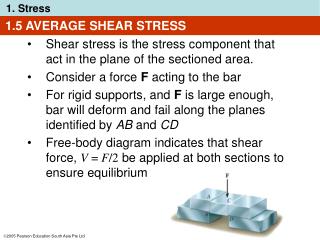
![Force [N/m]](https://cdn2.slideserve.com/4557374/slide1-dt.jpg)