Download
1 / 78
790 likes | 805 Views
Chapter. Accelerated Motion. 3. In this chapter you will:. Develop descriptions of accelerated motions. Use graphs and equations to solve problems involving moving objects. Describe the motion of objects in free fall. Chapter. Table of Contents. 3. Chapter 3: Accelerated Motion.

E N D
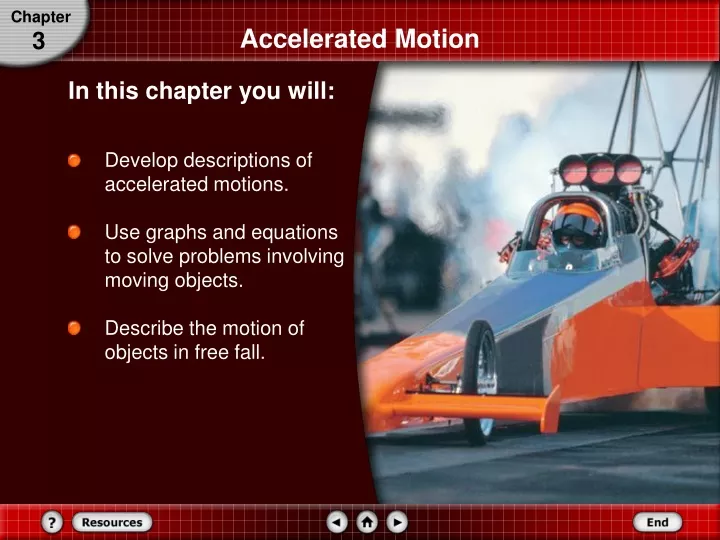
Chapter Accelerated Motion 3 In this chapter you will: • Develop descriptions of accelerated motions. • Use graphs and equations to solve problems involving moving objects. • Describe the motion of objects in free fall.
Chapter Table of Contents 3 Chapter 3: Accelerated Motion Section 3.1: Acceleration Section 3.2: Motion with Constant Acceleration Section 3.3: Free Fall Homework • Read Chapter 3. Complete Study Guide. • Graphical Analysis Packet • HW 3: handout
Section Warmup: Which Velocity Is It? 3.1 Physics Daily Warmup # 16 • There are two types of velocity that we encounter in our everyday lives. Instantaneous velocity refers to how fast something is moving at a particular point in time, while average velocity refers to the average speed something travels over a given period of time. • For each use of velocity described below, identify whether it is instantaneous velocity or average velocity. • The speedometer on your car indicates you are • going 65 mph. • A race-car driver was listed as driving 120 mph • for the entire race. • A freely falling object has a speed of 19.6 m/s after • 2 seconds of fall in a vacuum. • 4. The speed limit sign says 45 mph. instantaneous average instantaneous instantaneous
Section Acceleration 3.1 In this section you will: • Define acceleration. • Relate velocity and acceleration to the motion of an object. • Create velocity-time graphs.
Section Acceleration 3.1 Changing Velocity • You can feel a difference between uniform and nonuniform motion. • When you move in nonuniform motion, you feel pushed or pulled. • In contrast, when you are in uniform motion and your eyes are closed, you feel as though you are not moving at all.
Section Acceleration 3.1 Changing Velocity • Consider the motion diagrams below showing the distance between successive positions.
Section Acceleration 3.1 Changing Velocity • There are two major indicators of the change in velocity in this motion diagram. The change in the spacing of the stick figures or dots and the differences in the lengths of the velocity vectors indicate the changes in velocity.
Section Acceleration 3.1 Changing Velocity • If an object speeds up, each subsequent velocity vector is longer. • If the object slows down, each vector is shorter than the previous one. • Both types of motion diagrams give an idea of how an object’s velocity is changing.
Section Acceleration 3.1 Velocity-Time Graphs
Section Acceleration 3.1 Average and Instantaneous Acceleration • The rate at which an object’s velocity changes is called theaccelerationof the object. When the velocity of an object changes at a constant rate, it has a constant acceleration. • The average accelerationof an object is the change in velocity during some measurable time interval divided by that time interval. • Average acceleration is measured in m/s2. • The change in velocity at an instant of time is called instantaneous acceleration.
Section Please Do Now 3.1 Describe the part of a rollercoaster ride that would be uniform motion and the part that would be non-uniform motion. Write (3) lines.
Section Acceleration 3.1 Instantaneous Acceleration The instantaneous acceleration of an object can be found by drawing a tangent lineon the velocity-time graph at the point of time in which you are interested. The slope of this line is equal to the instantaneous acceleration. Example: Tangent line is drawn at t = 1.0 s and t = 5.0 s
Section Acceleration 3.1 Average Acceleration The average acceleration of an object can be found by plotting two points which define the time interval, connecting the points with a straight line, and finding the slope of the line. Example: slope of the line indicates the average acceleration between 1.0 and 5.0 s.
Section Velocity – Time Graph: Example 3.1 a) How would you describe the sprinter’s velocity and acceleration as shown on the graph? From the graph, note that the sprinter’s velocity starts at zero, increases rapidly for the first few seconds, and then, after reaching about 10.0 m/s, remains almost constant.
Section Velocity – Time Graph: Example 3.1 b) What is his instantaneous acceleration at t = 1 second and t = 5 seconds? Instantaneous acceleration: Draw a tangent to the curve at t = 1.0 s and t = 5.0 s. Find the slope of each line.
Section Velocity – Time Graph: Example 3.1 Solve for acceleration at 1.0 s: Solve for acceleration at 5.0 s: The acceleration is not constant because it changes from 3.4 m/s2 to 0.03 m/s2 at 5.0 s. The acceleration is in the direction chosen to be positive because both values are positive.
Section Velocity – Time Graph: Example 3.1 c) What is his average acceleration between 1 and 5 seconds? Average acceleration: Draw a line between the points at t = 1 s and t = 5 s. Find the slope of the line. The slope is 4 m/s 5 s = 0.8 m/s2
Section Exit Ticket 3.1 Write in your own words, what is the difference between velocity and acceleration?
Section Exit Ticket 3.1 • Is a ride on an escalator uniform or non-uniform motion? • What does the slope of the line on a position-time graph indicate? • What does the slope of the line on a velocity-time graph indicate? uniform velocity acceleration
Section Please Do Now 3.1 • Speed is how fast something is moving. • Velocity is how fast AND in what direction. • Acceleration is speeding up or slowing down AND in what direction. • Write 1-3 sentences using the words speed, velocity, and acceleration. Example: The rocket accelerated off the launch pad, gaining speed with each passing second. It reached a velocity of 25,000 miles per hour as it left the earths’s atmosphere.
Section Acceleration 3.1 Positive and Negative Acceleration • These four motion diagrams represent the four different possible ways to move along a straight line with constant acceleration. • Positive direction, speeding up • Positive direction, slowing down • Negative direction, speeding up • Negative direction, slowing down
Section Acceleration 3.1 Positive and Negative Acceleration v • When the object is speeding up, the velocity and acceleration vectors point in the same direction. (case 1 and 3) • When the object is slowing down, the velocity and acceleration vectors point in opposite directions (case 2 and 4) • Both the direction of an object’s velocity and its direction of acceleration are needed to determine whether it is speeding up or slowing down. a v a v a v a
Section Acceleration 3.1 Positive and Negative Acceleration v • An object has a positive acceleration when the acceleration vector points in the positive direction and a negative acceleration, when the acceleration vector points in the negative direction. • The sign of acceleration does not indicate whether the object is speeding up or slowing down. + a v - a v - a v +a
Section Acceleration 3.1 Determining Acceleration from a v-t Graph • Velocity and acceleration information also is contained in velocity-time graphs. • Graphs A, B, C, D, and E, as shown on the right, represent the motions of five different runners. • Positive velocity in this graph means the direction is east. Negative velocity means the direction is west.
Section Determining Acceleration from a v-t Graph 3.1 Describe the direction of motion, velocity and acceleration for: Graph A: Zero slope means zero acceleration; constant velocity towards the east. Graph B: Starting with zero velocity, picking up speed, moving towards the east. The straight line indicates constant acceleration. Graph C: Moving towards the east while slowing down and eventually stopping. Slowing down with a constant negative acceleration.
Section Determining Acceleration from a v-t Graph 3.1 Graph D: Moving towards the west while slowing down, turns around, then moves east while speeding up. Graph E: Moving west with constant velocity, zero acceleration. Remember, for a velocity-time graph: - positive velocity occurs when the line is anywhere above the x-axis - positive velocity means the object is moving in the positive direction, which might be east, to the right, etc. - the slope of the line indicated the acceleration - a straight line means constant acceleration
Section Acceleration 3.1 Determining Acceleration from a v-t Graph • The following equation expresses average acceleration as the slope of the velocity-time graph. • Average acceleration is equal to the change in velocity, divided by the time it takes to make that change.
Section Acceleration 3.1 Example: Suppose you run a wind sprints back and forth across the gym. You run at a speed of 4.0 m/s toward the wall, touch and run back at the same speed. The whole trip takes 10 seconds. What is your average acceleration if the positive direction is toward the wall? Givens: vi = 4 m/s; vf = -4 m/s; t = 10 s Unknown: a Equation: Substitute and Solve: Sense: The negative sign means the acceleration is away from the wall. Change in direction of motion results in acceleration.
Section Section Check 3.1 Question 1 Which of the following statements correctly define acceleration? • Acceleration is the rate of change of displacement of an object. • Acceleration is the rate of change of velocity of an object. • Acceleration is the amount of distance covered in unit time. • Acceleration is the rate of change of speed of an object.
Section Section Check 3.1 Answer 1 Answer:B Reason:The rate at which an object’s velocity changes is called acceleration of the object.
Section Section Check 3.1 Question 2 What happens when the velocity vector and the acceleration vector of an object in motion are in same direction? • The acceleration of the object increases. • The speed of the object increases. • The object comes to rest. • The speed of the object decreases.
Section Section Check 3.1 Answer 2 Answer:B Reason:When the velocity vector and the acceleration vector of an object in motion are in same direction, the speed of the object increases.
Section Section Check 3.1 Question 3 On the basis of the velocity-time graph of a car moving up a hill, as shown on the right, determine the average acceleration of the car? • 0.5 m/s2 • -0.5 m/s2 • 2 m/s2 • -2 m/s2
Section Section Check 3.1 Answer 3 Answer: B Reason:Average acceleration of an object is the slope of the velocity-time graph. vf = 0 vi = 25 m/s tf = 50 s ti = 0 a = vf – vi = 0 – 25 m/s = - 0.5 m/s2 tf – ti 50 s - 0
Section Please Do Now 3.2 In full sentences, write (2) things that are the same and (1) thing that is different about velocity and acceleration.
Section Please Do NowLow Road / High Road 3.2 In full sentences, state which steel ball will win the race and explain why. Use the words displacement, velocity and acceleration.
Section 3.2 3.1 Practice Problems, p. 64: 6, 7, 9, 10. Motion with Constant Acceleration Low Road / High Road Demo
Section Motion with Constant Acceleration 3.2 In this section you will: • Interpret position-time graphs for motion with constant acceleration. • Determine mathematical relationships among position, velocity, acceleration, and time. • Apply graphical and mathematical relationships to solve problems related to constant acceleration.
Section Motion with Constant Acceleration 3.2 Velocity with Average Acceleration • If an object’s average acceleration during a time interval is known, then it can be used to determine how much the velocity changed during that time. • The definition of average acceleration: can be rewritten as follows:
Section Motion with Constant Acceleration 3.2 Velocity with Average Acceleration • The equation for final velocity with average acceleration can be written as follows: • The final velocity is equal to the initial velocity plus the product of the average acceleration and time interval. vi
Section Motion with Constant Acceleration 3.2 Velocity with Average Acceleration • In cases in which the acceleration is constant, the average acceleration, ā, is the same as the instantaneous acceleration, a. • The equation for final velocity can be rearranged to find the time at which an object with constant acceleration has a given velocity. • It also can be used to calculate the initial velocity of an object when both the velocity and the time at which it occurred are given.
Section Motion with Constant Acceleration 3.2 Position with Constant Acceleration • The position data at different time intervals for a car with constant acceleration are shown in the table. • The data from the table are graphed as shown on the next slide.
Section Motion with Constant Acceleration 3.2 Position with Constant Acceleration • The graph shows that the car’s motion is not uniform: the displacements for equal time intervals on the graph get larger and larger. • The slope of a position-time graph of a car moving with a constant acceleration gets steeper as time goes on.
Section Motion with Constant Acceleration 3.2 Position with Constant Acceleration • The slopes from the position time graph can be used to create a velocity-time graph as shown on the right. • Note that the slopes shown in the position-time graph are the same as the velocities graphed in velocity-time graph.
Section Motion with Constant Acceleration 3.2 Position with Constant Acceleration • A velocity-time graph does not contain any information about the object’s position. • However, the velocity-time graph does contain information about the object’s displacement. • Recall that for an object moving at a constant velocity,
Section Motion with Constant Acceleration 3.2 Position with Constant Acceleration • On the graph shown on the right, v is the height of the plotted line above the t-axis, while Δt is the width of the shaded rectangle. The area of the rectangle, then, is vΔt, or Δd. Thus, the area under the v-t graph is equal to the object’sdisplacement. • The area under the v-t graph is equal to the object’s displacement.
Section Motion with Constant Acceleration 3.2 Finding the Displacement from a v-t Graph Example 1: The v-t graph below shows the motion of an airplane. Find the displacement of the airplane at Δt = 1.0 s and at Δt = 2.0 s.
Section Motion with Constant Acceleration 3.2 Finding the Displacement from a v-t Graph The displacement is the area under the v-t graph. The time intervals begin at t = 0.0.
Section Motion with Constant Acceleration 3.2 Finding the Displacement from a v-tGraph Identify the given and unknown variables. Given: v = +75 m/s Δt = 1.0 s Δt = 2.0 s Unknown: Δd = ?
Section Motion with Constant Acceleration 3.2 Finding the Displacement from a v-tGraph Solve for displacement during Δt = 1.0 s. Equation: Substitute: v = +75 m/s, Δt = 1.0 s Solve: