Download
1 / 91
920 likes | 1.06k Views
THE 2007 NATIONAL INTEGRITY PERCEPTION INDEX REPORT. By MALAYSIAN INSTITUTE OF INTEGRITY (IIM). PURPOSE. To present to the public the 2007 National Integrity Perception Index study findings, which will serve as guidelines and create awareness of the importance of integrity in our lives.

E N D
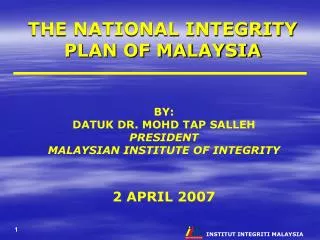
THE 2007 NATIONAL INTEGRITY PERCEPTION INDEX REPORT By MALAYSIAN INSTITUTE OF INTEGRITY (IIM)
PURPOSE To present to the public the 2007 National Integrity Perception Index study findings, which will serve as guidelines and create awareness of the importance of integrity in our lives. Also to ensure that each segment of society will cooperate, combining their energy towards efforts to reinforce and strengthen integrity.
TARGET 2008 NATIONAL INTEGRITY PLAN (NIP) • Effectively reduce corruption, malpractices and abuse of power; • Increase the efficiency of the public delivery system and overcome bureaucratic red tape; • Enhance corporate governance and business ethics; • Strengthen the family institution and the community; and • Improve the quality of life and the well-being of society.
THE AIM OF THE NATIONAL INTEGRITY PERCEPTION INDEX STUDY • As a mechanisme to measure the level of integrity based on the viewpoint, the environment and culture of Malaysian society; • To determine the effectiveness of the efforts and the implementation of the national integrity agenda; and • To ensure that efforts towards improving the integrity agenda are carried out in a systematic, consolidated and continuous manner.
COMPONENTS OF THE NATIONAL INTEGRITY INDEX • Corruption Perception Index; • Quality of Public Service Delivery Perception Index; • Business Ethics and Social Responsibility Perception Index; • Strength of the Family Institution and the Community Perception Index; • The Quality of Life and the Well-being of Society Perception Index; • Malaysian Courteousness Perception Index;
IMPLEMENTATION OF STUDY • This study was conducted as a collaboration effort between the Malaysian Institute of Integrity (IIM) and the Department of Statistics, Malaysia (JPM); • The study instruments were put together by the IIM and the Department of Statistics, with the cooperation of the expert group; 3. The Department of Statistics was responsible for conducting the field study to collect the data. 4. Fund Allocation from the Economic Planning Unit (EPU), channeled directly to the Department of Statistics, Malaysia.
THE ADVANTAGES OF THE NATIONAL INTEGRITY INDEX STUDY • The study was conducted by the Department of Statistics, Malaysia - an authority in research • Malaysians' own perceptions • Comprehensive - six components of integrity • Transparent and easy to understand index calculating technique
TARGET SAMPLE CHOICES RESPONDENTS % • Households' Group; • Civil Servants' Group; and • Economic Organisations' Group; 70 20 10
1. Households' samples - chosen to get the head of the family's general perception of the level of integrity in this country. 2.CivilServants' samples- aimed at getting the public servant's own feedback regarding the corruption scourge and the quality of the public service delivery system. 3.Economic organisations' samples - chosen to measure the perception of the business community towards the level of integrity in this country especially with regards to ethical business practices and social responsibility. RESPONDENTS
No Target group Respon-dents (%) 1. Households 10,023 67.0 2. Civil Servants 4, 031 26.9 3. Economic Organisations 913 6.1 Total 14,967 100.0 BREAKDOWN OF RESPONDENTS ACCORDING TO TARGET GROUPS
NUMBER OF RESPONDENTS ACCORDING TO GROUPS 4,031 (27%) 913 (6%) Economic Organisations Civil Servants Households; 10,023 (67%) TOTAL RESPONDENTS = 14,957
DISTRIBUTION OF HOUSEHOLD RESPONDENTS ACCORDING TO SEX 4,510 (45%) 5,513 (55%) WOMEN MEN
DISTRIBUTION OF HOUSEHOLD RESPONDENTS ACCORDING TO TERRITORY 4,250 (42%) Rural Urban 5,773 (58%)
DISTRIBUTION OF CIVIL SERVANT RESPONDENTS ACCORDING TO AGENCY State Statutory Body Local Authority 531 (13%) 1,520 (38%) 238 (6%) Ministry/ Federal Department 889 (22%) 853 (21%) State Government Department Federal Statutory Body
DISTRIBUTION OF CIVIL SERVANT RESPONDENTS ACCORDING TO CATEGORY OF POSITION 51 (1%) Top Management 670 (17%) Management &Professional 1,777 (44%) Support 2 1,533 (38%) Support 1
DISTRIBUTION OF ECONOMIC ORGANISATIONS' RESPONDENTS ACCORDING TO SECTORS Agriculture Sector 191 (21%) 382 (41%) Services Sector 170 (19%) 170 (19%) Construction Sector Manufacturing Sector
STUDY INSTRUMENTS 1. Questionnaires; 2. Face to face interviews; • Translation of questionnaires into certain languages; • Enumerators from the Department of Statistics, Malaysia; • Cronbach- = 0.833 – 0.928; and 6. Index Weight
Index Calculation Method 1. Cronbach- > 0.7 is reliable • Statistics experts from local universities 3. Discussion with expert groups and stakeholders to discuss study findings
Index Weight • The Index Weight is used to classify the importance of each one of the six (6) indexes which are assessed according to priority; • More than 100 questionnaires were distributed to focus groups consisting of academicians, government officers and IIM members, and their rankings of the importance of each index were the basis for forming the index weight.
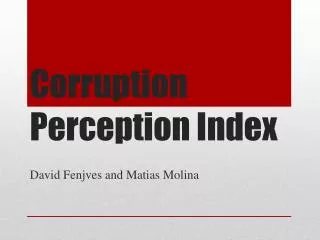
COMPONENTS OF THE CORRUPTION PERCEPTION INDEX • Understanding corruption (example: false claims, abuse of power, money politics, kickbacks; and • Perception about corruption (example: definition, adequacy and enforcement of laws, level of corruption, political corruption, etc).
PERCEPTION THAT THE LEVEL OF CORRUPTION PRACTICED IN THIS COUNTRY IS HIGH
PERCEPTION THAT THE CORRUPTION PREVENTION LAWS ARE NOT EFFECTIVELY ENFORCED
UNDERSTANDING CORRUPTION AND EXPERIENCES WITH THE CORRUPTION SCOURGE 2007 NO. ITEM Directly involved in the process of awarding contracts to family members is not corruption 1. 29.0% Directly involved in the process of appointing family members to fill department positions is not corruption 2. 36.5% Presenting accommodation claims for field assignments where accommodation was provided by organisers is not corruption 3. 37.7%
UNDERSTANDING CORRUPTION AND EXPERIENCES WITH THE CORRUPTION SCOURGE ITEM NO.. 2007 Corruption prevention laws and regulations in this country remain inadequate 4. 40.0% 5. Corruption prevention laws and regulations are not effectively enforced 41.8% Safety of witnesses and informants on corruption is not ensured 6. 38.8%
PERCEPTION ABOUT THE CORRUPTION SCOURGE NO. ITEM 2007 1. The level of corruption and acceptance of bribes in this country is high 53.9% Corruption in the political sector today is out of control 2. 52.5% The level of corruption prevention today is more effective compared to last year (2006) 3. 63.8%
SOME FACTORS INFLUENCING THE FALL IN THE INDEX • The emergence of high profile cases such as Tan Sri Eric Chia, Tan Sri Kasitah Gaddam, Datuk Mohd Said Yusof, former Jasin Member of Parliament and Allahyarham Datuk Zakaria Md Derus, former ADUN of Pelabuhan Klang; • The opennessand transparency of the government also contributed to the increased perception within society that the practice of corruption in this country was getting worse; • Society today is more concerned over corruption issues. For example, many corruption cases are stated in various blogs. 58% of Malaysians are now "internet savvy" (SKMM study); • 4. The increase in complaints/investigations/arrests shown in the media also affected the perception of the people about corruption in this country.
2 THE PUBLIC SERVICE DELIVERY QUALITY INDEX STUDY FINDINGS
COMPONENTS OF THE PUBLIC SERVICE DELIVERY QUALITY INDEX • Quality of public service delivery (example: punctuality, level of knowledge, attitude, friendliness of service, waiting time, willingness to protect secrets); and • Perception of public servants towards their own workplace.
When dealing with government agencies, the service did not meet the timeframe promised in the Clients' Charter
Government servants are not sincere in assisting customers solve their problems
PERCEPTION ON PUBLIC SERVICE QUALITY ITEM 2007 NO. Civil Servants are capable of making quick decisions 1. 59.6% Civil Servants always follow fixed work procedures 2. 69.2% Civil Servants have knowledge about their duties 3. 69.6%
PERCEPTION ON PUBLIC SERVICE QUALITY ITEM NO. 2007 Customers obtain services within the time period promised in the Clients' Charter 4. 59.7% Civil Servants practice customer friendly attitude 66.4% 5. The quality of public service is better compared to the year 2006 6. 71.3%
Perception of civil servants themselves that government servants are able to work quickly
SOME FACTORS INFLUENCING THE FALL IN THE INDEX • 1. The expectation of society towards the quality of public service is increasing further due to the increase in private sector wages and emoluments during the study; • 2. Some basic services (SLR) offered by the Local Authorities failed to meet the people's expectation and often get negative coverage by the media; • Certain counter services still fail to provide efficient and customer friendly services and contribute to society's negative perception of the quality of public service.
3 The 2007 BUSINESS ETHICS AND SOCIAL RESPONSIBILITY PERCEPTION INDEX STUDY FINDINGS
COMPONENTS OF THE 2007 ETHICAL BUSINESS PRACTICES AND SOCIAL RESPONSIBILITY PERCEPTION INDEX • Consumers' perception towards ethical business practices and the business community's social responsibility; and • Economic organisations' perception towards ethical practices and social responsibility in their respective companies.
PERCEPTION ON ETHICAL BUSINESS PRACTICES 2007 ITEM NO. Consumers are satisfied with the price charged 1. 56.3% Customers are satisfied with the courteousness of business people 2. 70.8% Customers are satisfied with the quality of the products and services offered by businesspeople 72.2% 3.
PERCEPTION ON ETHICAL BUSINESS PRACTICES ITEM NO. 2007 The private sector contributes towards building public amenities 4. 27.1% 5. Company’s Code of Ethics understood by all staff 98.9% 6. Companies understand about Malaysian Code on Corporate Governance (MCCG) 37.9% Companies understand the Malaysian Code of Business Ethics 7. 52.9%
THE 2007 BUSINESS ETHICS AND SOCIAL RESPONSIBILITY PERCEPTION INDEX 6.90
SOME FACTORS INFLUENCING THE RISE IN THE INDEX 1. PEMUDAH, which was set up during the study period has simplified the workings of the private sector and the government; 2. An increasing number of companies are adopting and using the Business Ethics Code in their business operations; and 3. Integrity strengthening programmes by IIM for business people such as the Corporate Integrity Advocacy Programme jointly organised with ACCCIM and entrepreneur seminars conducted by IIM are effective and help improve the index.
THE STRENGTH OF THE FAMILY INSTITUTION AND THE COMMUNITY PERCEPTION INDEX STUDY FINDINGS 4
COMPONENTS OF STRENGTH OF THE FAMILY INSTITUTION AND THE COMMUNITY PERCEPTION INDEX • Respondents' perception on the strength of own family (example: spending time with family, manifestations of love, communication between family members, discipline in family); and • Respondents' perception on the condition of their neighbourhoods.
PERCEPTION ON FAMILY LIFE NO. ITEM 2007 Family members have enough time with their family 1. 79.2% Family members exhibit love and affection amongst themselves 2. 83.3% Family members have trust in each other 3. 82.6%
PERCEPTION ON FAMILY LIFE 2007 NO. ITEM Family members always eat together 4. 77.3% 5. Family members do activities together. (eg: exercise and picnics etc.) 72.9% Family members have to be home by a certain time 69.6% 6.