Download
1 / 1
20 likes | 157 Views
November 2005. United States - East Coast and Gulf of Mexico. Region 8 – South Texas Coast. Chl a concentrations off the coast of south Texas exhibit a statistically significant increasing trend over the length of the record examined, January 1998 to December 2005.

E N D
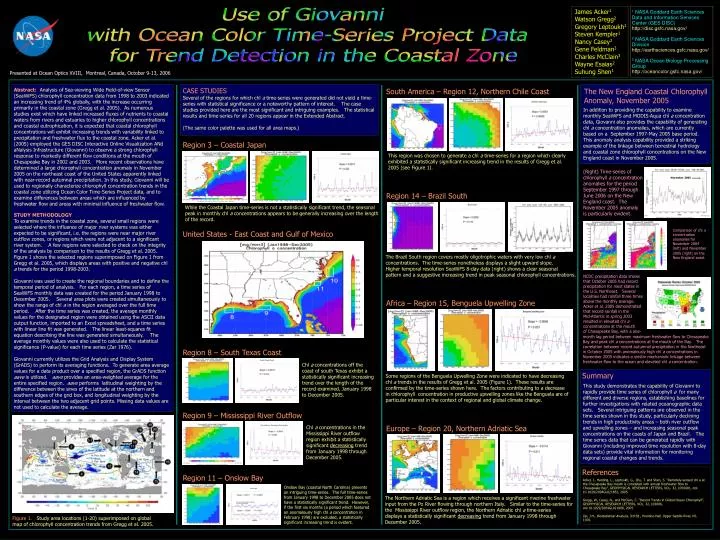
November 2005 United States - East Coast and Gulf of Mexico Region 8 – South Texas Coast Chl a concentrations off the coast of south Texas exhibit a statistically significant increasing trend over the length of the record examined, January 1998 to December 2005. Region 9 – Mississippi River Outflow Chl a concentrations in the Mississippi River outflow region exhibit a statistically significant decreasing trend from January 1998 through December 2005. Region 11 – Onslow Bay Onslow Bay (coastal North Carolina) presents an intriguing time-series. The full time-series from January 1998 to December 2005 does not have a statistically significant trend. However, if the first six months (a period which featured an anomalously high chl a concentration in February 1998) are excluded, a statistically significant increasing trend is evident. James Acker1 Watson Gregg2 Gregory Leptoukh1 Steven Kempler1 Nancy Casey2 Gene Feldman3 Charles McClain3 Wayne Esaias2 Suhung Shen1 Use of Giovanni with Ocean Color Time-Series Project Data for Trend Detection in the Coastal Zone 1 NASA Goddard Earth Sciences Data and Information Services Center (GES DISC) http://disc.gsfc.nasa.gov/ 2 NASA Goddard Earth Sciences Division http://earthsciences.gsfc.nasa.gov/ 3 NASA Ocean Biology Processing Group http://oceancolor.gsfc.nasa.gov/ Presented at Ocean Optics XVIII, Montreal, Canada, October 9-13, 2006 Abstract:Analysis of Sea-viewing Wide Field-of-view Sensor (SeaWiFS) chlorophyll concentration data from 1998 to 2003 indicated an increasing trend of 4% globally, with the increase occurring primarily in the coastal zone (Gregg et al. 2005). As numerous studies exist which have linked increased fluxes of nutrients to coastal waters from rivers and estuaries to higher chlorophyll concentrations and coastal eutrophication, it is expected that coastal chlorophyll concentrations will exhibit increasing trends with variability linked to precipitation and freshwater flux to the coastal zone. Acker et al. (2005) employed the GES DISC Interactive Online Visualization ANd aNalysis Infrastructure (Giovanni) to observe a strong chlorophyll response to markedly different flow conditions at the mouth of Chesapeake Bay in 2002 and 2003. More recent observations have determined a large chlorophyll concentration anomaly in November 2005 on the northeast coast of the United States apparently linked with near-record autumnal precipitation. In this study, Giovanni will be used to regionally characterize chlorophyll concentration trends in the coastal zone utilizing Ocean Color Time-Series Project data, and to examine differences between areas which are influenced by freshwater flow and areas with minimal influence of freshwater flow. CASE STUDIES Several of the regions for which chl a time-series were generated did not yield a time-series with statistical significance or a noteworthy pattern of interest. The case studies provided here are the most significant and intriguing examples. The statistical results and time-series for all 20 regions appear in the Extended Abstract. (The same color palette was used for all area maps.) South America – Region 12, Northern Chile Coast The New England Coastal Chlorophyll Anomaly, November 2005 In addition to providing the capability to examine monthly SeaWiFS and MODIS-Aqua chl a concentration data, Giovanni also provides the capability of generating chl a concentration anomalies, which are currently based on a September 1997-May 2005 base period. This anomaly analysis capability provided a striking example of the linkage between terrestrial hydrology and coastal zone chlorophyll concentrations on the New England coast in November 2005. Region 3 – Coastal Japan This region was chosen to generate a chl a time-series for a region which clearly exhibited a statistically significant increasing trend in the results of Gregg et al. 2005 (see Figure 1). (Right) Time-series of chlorophyll a concentration anomalies for the period September 1997 through June 2006 on the New England coast. The November 2005 anomaly is particularly evident. Region 14 – Brazil South While the Coastal Japan time-series is not a statistically significant trend, the seasonal peak in monthly chl a concentrations appears to be generally increasing over the length of the record. STUDY METHODOLOGY To examine trends in the coastal zone, several small regions were selected where the influence of major river systems was either expected to be significant, i.e. the regions were near major river outflow zones, or regions which were not adjacent to a significant river system. A few regions were selected to check on the integrity of the analysis by comparison to the results of Gregg et al. 2005. Figure 1 shows the selected regions superimposed on Figure 1 from Gregg et al. 2005, which displays areas with positive and negative chl a trends for the period 1998-2003. Giovanni was used to create the regional boundaries and to define the temporal period of analysis. For each region, a time series of SeaWiFS monthly data was created for the period January 1998 to December 2005. Several area plots were created simultaneously to show the range of chl a in the region averaged over the full time period. After the time series was created, the average monthly values for the designated region were obtained using the ASCII data output function, imported to an Excel spreadsheet, and a time series with linear line fit was generated. The linear least-squares fit equation describing the line was generated simultaneously. The average monthly values were also used to calculate the statistical significance (P-value) for each time series (Zar 1976). Giovanni currently utilizes the Grid Analysis and Display System (GrADS) to perform its averaging functions. To generate area average values for a data product over a specified region, the GrADS function aave is utilized. aave provides an area-weighted average for the entire specified region. aave performs latitudinal weighting by the difference between the sines of the latitude at the northern and southern edges of the grid box, and longitudinal weighting by the interval between the two adjacent grid points. Missing data values are not used to calculate the average. Comparison of chl a concentration anomalies for November 2004 (left) and November 2005 (right)on the New England coast. The Brazil South region covers mostly oligotrophic waters with very low chl a concentrations. The time-series nonetheless displays a slight upward slope. Higher temporal resolution SeaWiFS 8-day data (right) shows a clear seasonal pattern and a suggestive increasing trend in peak seasonal chlorophyll concentrations. NCDC precipitation data shows that October 2005 had record precipitation for most states in the U.S. Northeast. Several localities had rainfall three times above the monthly average. Acker et al. 2005 demonstrated that record rainfall in the Mid-Atlantic in spring 2003 resulted in elevated chl a concentrations at the mouth of Chesapeake Bay, with a one- Africa – Region 15, Benguela Upwelling Zone month lag period between maximum freshwater flow to Chesapeake Bay and peak chl a concentrations at the mouth of the Bay. The correlation between record autumnal precipitation in the Northeast in October 2005 with anomalously high chl a concentrations in November 2005 indicates a similar mechanistic linkage between freshwater flow to the ocean and elevated chl a concentration. Summary Some regions of the Benguela Upwelling Zone were indicated to have decreasing chl a trends in the results of Gregg et al. 2005 (Figure 1). These results are confirmed by the time-series shown here. The factors contributing to a decrease in chlorophyll concentration in productive upwelling zones like the Benguela are of particular interest in the context of regional and global climate change. This study demonstrates the capability of Giovanni to rapidly provide time series of chlorophyll a for many different and diverse regions, establishing baselines for further investigations with related oceanographic data sets. Several intriguing patterns are observed in the time series shown in this study, particularly declining trends in high productivity areas – both river outflow and upwelling zones – and increasing seasonal peak concentrations on the coasts of Japan and Brazil. The time series data that can be generated rapidly with Giovanni (including improved time resolution with 8-day data sets) provide vital information for monitoring regional coastal changes and trends. Europe – Region 20, Northern Adriatic Sea References Acker, J., Harding, L., Leptoukh, G., Zhu, T. and Shen, S. “Remotely-sensed chl a at the Chesapeake Bay mouth is correlated with annual freshwater flow to Chesapeake Bay”, GEOPHYSICAL RESEARCH LETTERS, VOL. 32, L056001, doi: 10.1029/2004GL021852, 2005. Gregg, W., Casey, N., and McClain, C. “Recent Trends in Global Ocean Chlorophyll”, GEOPHYSICAL RESEARCH LETTERS, VOL. 32, L03606, doi:10.1029/2004GL021808, 2005. Zar, J.H., Biostatistical Analysis, 3rd Ed., Prentice-Hall, Upper Saddle River, NJ, 1976. The Northern Adriatic Sea is a region which receives a significant riverine freshwater input from the Po River flowing through northern Italy. Similar to the time-series for the Mississippi River outflow region, the Northern Adriatic chl a time-series displays a statistically significant decreasing trend from January 1998 through December 2005. Figure 1.Study area locations (1-20) superimposed on global map of chlorophyll concentration trends from Gregg et al. 2005.