Download
1 / 3
30 likes | 91 Views
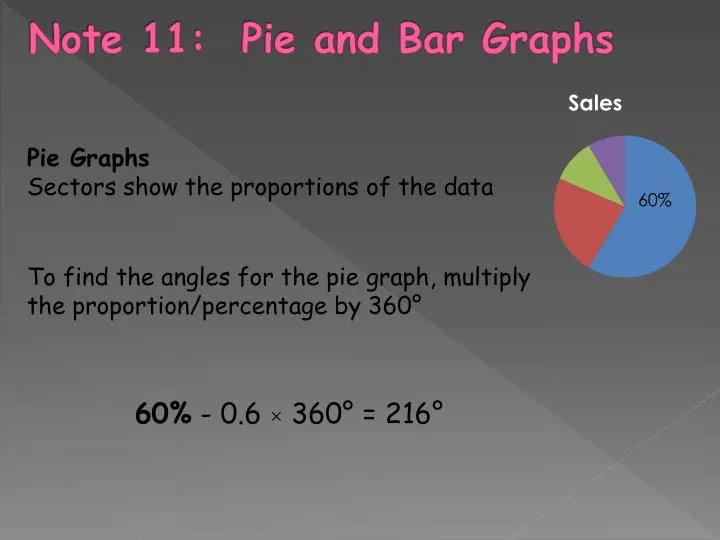
Note 11: Pie and Bar Graphs. Pie Graphs Sectors show the proportions of the data. To find the angles for the pie graph, multiply t he proportion/percentage by 360°. 60% - 0.6 × 360° = 216°. Histogram – display grouped continuous data. – area represents the frequency. frequency.

E N D
Note 11: Pie and Bar Graphs Pie Graphs Sectors show the proportions of the data To find the angles for the pie graph, multiply the proportion/percentage by 360° 60% - 0.6 × 360° = 216°
Histogram – display grouped continuous data – area represents the frequency frequency Bar Graphs – display discrete data Distance (cm) – counted data – draw bars (lines) with the same width – height represents frequency
Page 254 Exercise E and F