Download
1 / 21
210 likes | 346 Views
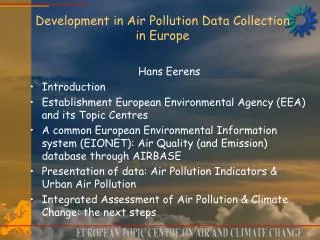
Air Pollution in Europe 2004. Based mainly upon AirBase data as well as on gap-filled emissions data (AEAT) ETC/ACC project group: de Leeuw, MNP Adams, AEAT Pulles, vh Bolscher, TNO Tarrason, van Loon, MET.NO Larssen, Barrett, NILU Presented at the EIONET11 Workshop, La Rochelle.

E N D
Air Pollution in Europe 2004 Based mainly upon AirBase data as well as on gap-filled emissions data (AEAT) ETC/ACC project group: • de Leeuw, MNP • Adams, AEAT • Pulles, vh Bolscher, TNO • Tarrason, van Loon, MET.NO • Larssen, Barrett, NILU Presented at the EIONET11 Workshop, La Rochelle
Contents of the report • Driving forces • Emissions, developments since 1990 • Health related AP: PM, Ozone, NO2, benzene • Ecosystems related AP: acid/eutro • Policy effectiveness I will concentrate on the health related air pollutants
Sector contributions in EU15 and EU10 differ EU 15 EU 10
Trends in European emissions PM primary and secondary Acidity / eutrophication Ozone precursors
Country-wise emissions trendsExample: ozone precursors, 1990-2004
Overview of tendencies since 1996:potential urban population exposure
The NO2 situation,2004 • 2,327 stations (2090 with <70% dc) • 805 UB, 610 UT, 285 rural, 181 UI
The PM10 situation • 1815 stations (1587 with <70% dc) • 742 UB, 483 UT, 180 rural, 190 Ind
PM10 in 2003 and 2004 2004 2003
Trends and explanations Modelled PM10 with EMEP model Emissions Concentrations