Download
1 / 39
390 likes | 515 Views
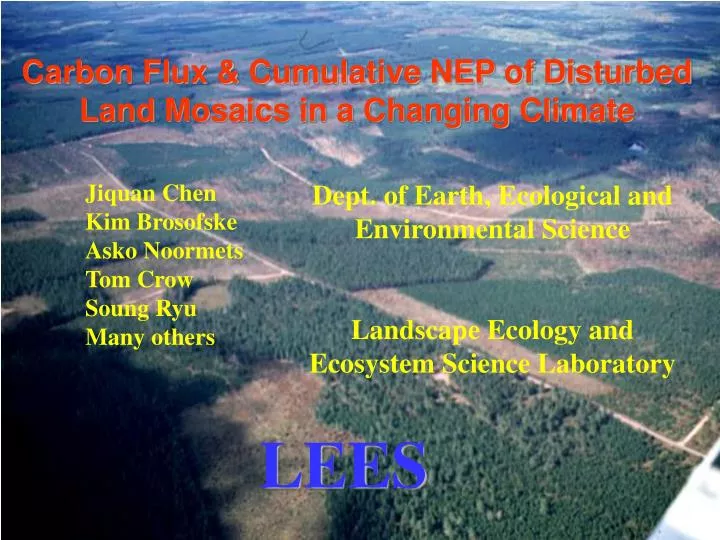
Carbon Flux & Cumulative NEP of Disturbed Land Mosaics in a Changing Climate. Dept. of Earth, Ecological and Environmental Science Landscape Ecology and Ecosystem Science Laboratory. Jiquan Chen Kim Brosofske Asko Noormets Tom Crow Soung Ryu Many others. LEES. Current Questions.

E N D
Carbon Flux & Cumulative NEP of Disturbed Land Mosaics in a Changing Climate Dept. of Earth, Ecological and Environmental Science Landscape Ecology and Ecosystem Science Laboratory Jiquan Chen Kim Brosofske Asko Noormets Tom Crow Soung Ryu Many others LEES
Current Questions • What are the major obstacles to understanding landscape-scale flux processes when the landscape is composed of contrasting patches? • How variable is NEC among patches of different types and ages? Our central hypothesis is that the cumulative NEP of a landscape is determined by the land mosaic -- the various ages and types of ecosystems present and their spatial arrangement. Hypothesis
(a) (c) (b) NEP Changes Changes in NEP with age (a) and the age structure of a hypothetical landscape (b) together determine the cumulative NEP of the landscape (c)
Objective To enhance the understanding of landscape-level carbon exchange in disturbed land mosaics, taking into specific consideration age structure, patch type, and dynamics climate.
Conceptual framework for studying landscape-level carbon flux and storage in disturbed land mosaics, with explicit consideration of disturbance regime and landscape structure, including the area-of-edge influences (AEI).
Study Area LandSAT ETM+
Figure 1. Cover-type map of the study area within the Chequamegon National Forest, WI landscape. The labels on the map indicate the location of the sampled patch types for soil respiration measurements. CC = clearcuts, JP = Jack pine, MH = mature hardwoods, PB = pine barrens, RP = red pine, YH = young hardwoods
Classification of the northern portion of the Chequamegon National Forest, Washburn Ranger District from 2001. Triangles indicate ecosystems containing Eddy-Covariance Towers M. Red Pine Y. Hardwood Pine Barrens Y. Red Pine M. Hardwood
Methods A combination of direct measurements, remote sensing images, and ecosystem models.
Results Diurnal net exchange of CO2 at five forest ecosystems in the Chequamegon National Forest, N. Wisc. Data were collected using eddy-covariance systems and WPL corrections were made.
Results Cumulative C flux of five ecosystems in CNF between May and Sept., 2002.
PnET Model http://www.pnet.sr.unh.edu/
PnET: A Generic Model The Flow Chart of the Model The GUI of PnET
PnET has been applied at many forests in USA Oak-Maple Douglas-fir Lodgepole Pine Northern Hardwood Red Pine & Oak Maple Taiga Aspen & White Spruce Pine Mixed Hardwood Slash Pine
Note: * means the value not constant • We propose to initially utilize available parameters • We propose to test available parameters against experimental data parameterization
Gross carbon exchange in a mature hardwood forest in N. Wisconsin between May and September 2002. GCE (g C m-2.dya-1)
Gross carbon exchange in a mature hardwood forest in N. Wisconsin between May and September 2002. GCE (g C m-2.dya-1) Julian Day
Comparison of measured (NCE+Rs) & predicted GCE (PnET model) for a mature hardwood forest in N. Wisconsin in 2002. Predicted GCE (g C m-2 day-1) Minus Ra 1:1 line Measured GCE (g C m-2 day-1)
Changes of predicted residuals with environmental variables for a mature hardwood forest in N. Wisconsin in 2002. Julian Day PAR Max Temp Min Temp Predicted - Measured
Changes of predicted residuals with daily maximum and minimum temperatures for a mature hardwood forest in N. Wisconsin in 2002. Residuals Max Temp Min Temp
Gross carbon exchange in a mature red pineforest in N. Wisconsin between May and September 2002. GCE (g C m-2.dya-1) Julian Day
Gross carbon exchange in a mature red pine forest in N. Wisconsin between May and September 2002. GCE (g C m-2.dya-1) Julian Day
Comparison of measured (NCE+Rs) & predicted GCE (PnET model) for a mature red pine forest in N. Wisconsin in 2002. Predicted GCE (g C m-2 day-1) 1:1 line Measured GCE (g C m-2 day-1)
Changes of predicted residuals with environmental variables for a mature red pine forest in N. Wisconsin in 2002. Julian Day PAR Predicted - Measured Max Temp Min Temp
Changes of predicted residuals with daily maximum and minimum temperatures for a mature red pine forest in N. Wisconsin in 2002. Residuals Max Temp Min Temp
Changes of predicted residuals with daily maximum and minimum temperatures for a young hardwood forest in N. Wisconsin in 2002. Residuals Max Temp Min Temp
Changes of predicted residuals with daily maximum and minimum temperatures for a young red pine forest in N. Wisconsin in 2002. Residuals Max Temp Min Temp
Changes of predicted residuals with daily maximum and minimum temperatures for a pine Barrens in N. Wisconsin in 2002. Residuals Max Temp Min Temp
Comparison of measured (NCE+Rs) & predicted GCE (PnET model) for a young hardwood forest in N. Wisconsin in 2002. Predicted GCE (g C m-2 day-1) Measured GCE (g C m-2 day-1)
Comparison of measured (NCE+Rs) & predicted GCE (PnET model) for a young red pine forest in N. Wisconsin in 2002. Predicted GCE (g C m-2 day-1) Measured GCE (g C m-2 day-1)
Comparison of measured (NCE+Rs) & predicted GCE (PnET model) for a pine barrens in N. Wisconsin in 2002. Predicted GCE (g C m-2 day-1) Measured GCE (g C m-2 day-1)
Mature red pine Mature hardwood 1:1 line Predicted GCE (g C m-2 day-1) Young hardwood Young red pine Pine barrens Measured GCE (g C m-2 day-1)
Gross carbon exchange in a mature hardwood (left) and red pine (right) forest in N. Wisconsin between May and September 2002. The differences are highly correlated with daily min and max temperature. Max Temp Max Temp Min Temp Min Temp GCE (g C m-2.dya-1) Residuals Residuals
Discussion Exploring the unique biophysical controls of C flux is essential for an mechanistic understanding and predictions of the differences and their changes over time.
Mobile Unit & Towers GCM Predictions Landuse Scenarios (flux,LAI, etc.) Land Cover Climate Land Cover Climate Image process & comparison Surface RS Surface RS Data Data Data Data parameterization parameterization spatialization inversion PnET + SiB2 New Model regional Flux validation feedback CO & CH Flux CO & CH Flux 2 4 2 4 Figure 1. Proposed framework for predicting changes of CO2 and CH4 fluxes in five Midwest states (WI, IL, IN, OH, and MI) under various climate and land use scenarios.
Fig. 2. Land cover and locations of field campaigns for predicting regional CO2 and CH4 fluxes. The region is dominated by forests, croplands, pasture land (and wooded area), and growing urban areas. Data collected at the 12 AmeriFlux towers is shared and publicly available. A new flux tower in Toledo and 3 mobile systems will be deployed to sample 9-12 additional ecosystems. A Trace Gas Analyzer TGA-100 will be added to the eddy-covariance systems for measuring CH4 flux (with a circle).