Download
1 / 12
120 likes | 206 Views
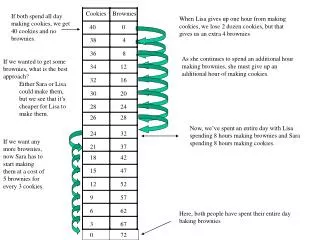
Measuring production & productivity: How many cookies can CM make?. What is a PPC? Why is efficiency important to an economy? Explain the law of increasing opportunity cost. When does economic growth occur?. What is a PPC/PPF?. Scarcity means a society’s capacity to produce is limited.

E N D
Measuring production & productivity:How many cookies can CM make? What is a PPC? Why is efficiency important to an economy? Explain the law of increasing opportunity cost. When does economic growth occur?
What is a PPC/PPF? • Scarcity means a society’s capacity to produce is limited. • We can model how an economy might use its resources to produce two goods. • This model is called a production possibilities curve or pp frontier—it shows the maximum possible output for an economy • Efficiency, or producing the max output using all available resources and technology fully. • All points on the curve are points of efficiency.
There are two assumptions made: Fixed resources: all resources remain unchanged (no way to increase); can shift any resource from producing one output to another Technology, or the knowledge applied to how goods/services are produced, is fixed. The PPC helps us see trade-offs made in producing g/s Shows us points of efficiency, inefficiency, and underutilization—when an economy fails to fully use its resources Shows us limits ofproduction—when existing resources and technology are not enough to produce more (unattainable output) What is shown in a PPC?
The PPF can also show us opp. costs of different production choices The curve in a PPC shows that the trade-offs in an economy are not the same at every point on the curve. So: the oc when choosing to produce more of either good changes as you move along the curve This could be because of the types of resources being used. Law of increasing opportunity cost—opportunity cost increases as production of an output expands as more resources are used to produce one good, there is less for the other. Exists because not all resources are equally suited to all types of production Measuring opportunity costs
Productivity—the quantity of output per unit of input, or the quantity of output produced by all inputs. Outputs = Productivity Inputs An increase in productivity= producing more goods and services with the same amount of resources OR producing the same amount of goods and services with fewer resources OR a combination of the two possibilities Over time, productivity growth means that the average worker is producing more per hour Makes the average standard of living in the economy higher assumes additional output is of goods and services that people value. Producing more output that is of no value is not a real increase in productivity. Productivity?
Check yourself! • What might cause a growth in the economy? • Gain resources, technological change • What does a PPC show us? • Efficiency, trade-offs, and opportunity costs, along with production • How do we measure productivity? • Outputs/inputs