Download
1 / 19
190 likes | 327 Views
The methodology and applications of Agricultural Landscape monitoring in E stonia. Kalev Sepp, Institute of Environmental Protection Estonian Agricultural University. Proposed concept of landscape monitoring program in Estonia.

E N D
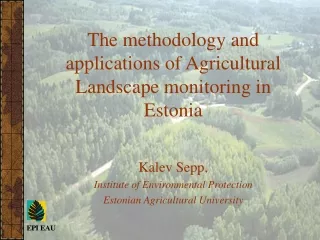
The methodology and applications of Agricultural Landscape monitoring in Estonia Kalev Sepp, Institute of Environmental Protection Estonian Agricultural University
The main purposes of the agricultural monitoring programme were defined as follows • To follow up and evaluate the environmental effects of land and agricultural reforms • To define changes in land use structure in the different type of agricultural landscapes (intensive and extensive land use) • To study changes in land cover types, especially fallow land and semi-natural areas • To explain the connection between landscape structure indicators and the characteristics of ecological status of agricultural landscapes
Conceptual scheme of agricultural landscape monitoring programme
Monitoring of agricultural landscapes • Spatial structure of landscape • aerial • linear • point • Historical overview of landscape change • Level of human pressure • earthworms • epigenic fauna of soils • soil-microorganisms • bumblbees
Test areas • Regional distribution according to the Estonian landscape regions • Distribution all over the country • Intensive and extensive areas as well as marginal areas of agriculture • Availability of additional data • Good relation to other sites of environmental monitoring • Localities were divided into two groups • intensively used agricultural areas (IUAA) • extensively used agricultural areas(LIUAA)
buffer zones <5m buffer zones >5m ecotones between cultivated land and broad-leaved forests ecotones between cultivated land and mixed or coniferous forests ditches and brooks arable land semi-natural grasslands fallow land mixed forests coniferous forests broad–leaved forests bushes wetlands cultivated grasslands pastures legumes Examples from landscape pattern analysis
Methods of studying human pressure on agricultural land • The following earthworm and soil microbial community parameters were described: • · number of individuals and species of earthworms (Lumbricidae) per 1 m2; • · maximum dominance in earthworm community (%); • · diversity of soil microbial and earthworm communities; • · total hydrolytical activity of soil microorganisms; • · the number of colony forming microorganisms per 1 g of dry soil.
Methods for analysing the landscape diversity changes in monitoring areas • Time period - over the last 50 years • Time sections 1950–1955; 1970–1975; 1995–1999 • Black-and-white interpreted aerial photos in the scale of 1:10 000 were used. • Aerial photos were scanned by AGFS scanner (A3) and transformed using the software ARC/Info. • Scanned aerial photos were vectorised and encoded in the environment of the software MapInfo and GeoGraphics. Classification included different polygon elements (e.g. arable lands, forests, grasslands, waters, bushes and brushwood, other lands).
The main objectives of the research • To investigate the relationship between the landscape structure and the abundance and composition of indicator species - bumble bees • To develop a general concept of agricultural landscape monitoring in Estonia
Methods for bumblebee studies in agricultural landscapes • Counts were carried out in nine localities localities in 1996-1999 • Localities were divided into two groups • intensively used agricultural areas (IUAA) (the percentage of arable land was >65%) • extensively used agricultural areas(LIUAA) (the percentage of arable land was <45%). • Each locality included two transects (2×1,000 m) • Both transects were divided into 20×2 m plots • Transects were observed regularly from July to August
Methods for bumblebee studies in agricultural landscapes • Counts were made by the same observer on the same day in the weather conditions optimal for bees • The following information was recorded each time: • bumblebee individuals were encountered • species and cast • food plant(s) foraged • Study areas (1200 ha each) were mapped on the land use plan in scale 1: 10,000
Statistical analysis of data sets • Principal Component Analysis (PCA) of the landscape elements and the bumble bee species found was carried out • The results of PCA are interpreted using scatters of the site scores connected with group centroids (star plot), and via correlation circles • The effect of the grouping factor was estimated using a multivariate randomisation test (Manly, 1995) with 1,000 permutations • The influence of landscape structure on bumble bee communities was studied with co-inertia analysis
B. veteranus B. pratorum PCA based on the regional bumble bee distribution LIUAA LIUAA IUAA IUAA The first and second principal components described 30.9% and 18.7% of the overall data variation, respectively
cultivated grasslands wetlands arable lands PCA based on landscape elements LIUAA IUAA PCA on landscape elements matrix described 28.7%, 21.9% and 19.8% of the overall data variation
Results of co-inertia analysis • The permutation test revealed that the co-structure between the data sets of landscape elements and bumble bee species was highly significant (P<0.001) • The correlation coefficients between the two new sets of co-ordinates for the first and second axes of the co-inertia analysis were 0.87 and 0.97, respectively
The most important elements of landscape and bumblebee species defining the first two factors of the co-inertia analysis
Conclusion • The correlation circle of the bumble bee species found demonstrated that the species relevant to the grouping of study sites into IUAA and LIUAA were • B. pratorum (7) • B. sylvestris (9) • B. lapidarius (1) • B. veteranus (4)
Conclusion • The species composition and abundance of bumble bees was to a great degree determined by landscape structure • The permutation test revealed that the co-structure between the data sets of landscape elements and bumble bee species was highly significant (P<0.001) • The correlation coefficients between the two new sets of co-ordinates for the first and second axes of the co-inertia analysis were 0.87 and 0.97, respectively • Bumble-bees can be use as bio-indicators for evaluation natureless of agricultural landscapes