Download
1 / 1
10 likes | 107 Views
Study examines trends and uncertainties in stratospheric and tropospheric temperatures using various data sets and reanalysis products. Findings reveal different trends based on latitude and height. The report discusses the importance of data sources in temperature trend analysis.

E N D
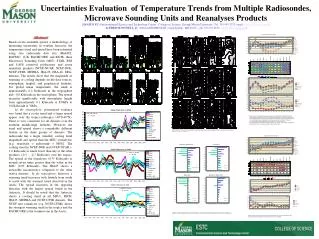
Uncertainties Evaluation of Temperature Trends from Multiple Radiosondes, Microwave Sounding Units and Reanalyses ProductsJIANJUN XU (Environmental Science and Technology Center , College of Science, George Mason University. Tel: 703-993-3233; email: jianjun.xu@noaa.gov); ALFRED M. POWELL, Jr. (NOAA/NESDIS/STAR, Camp Springs, MD 20746; ph. 301-763-8127; Al.Powell@noaa.gov) Stratospheric Temperature (Ch4) Abstract Based on the ensemble spread, a methodology of measuring uncertainty in weather forecasts, the temperature trend and spread have been estimated using five radiosonde data sets (HadAT2, RATPAC, IUK, RAOBCORE and RICH), three Microwave Sounding Units (MSU: STAR, RSS and UAH) retrieved productions and seven reanalysis products (NCEP-NCAR, NCEP-DOE, NCEP-CFSR, MERRA, JRA-25, ERA-40, ERA-interim). The results show that the magnitude of warming or cooling depends on the data sources, atmospheric heights, and geophysical latitudes. For global mean temperature, the trend is approximately 0.2 K/decade in the troposphere and −0.8 K/decade in the stratosphere. The spread increases significantly with atmospheric height from approximately 0.1 K/decade at 850hPa to 0.8 K/decade at 30hPa. In the stratosphere, pronouncedevidence was found that a cooler trend and a larger spread appear over the tropics-subtropics (40°S-40°N). There is very consistent for all datasets over the northern middle-high latitudes. However, the trend and spread shows a remarkably different feature in the three groups of datasets. The radiosonde has a larger (smaller) cooling trend magnitude and spread than the MSU (reanalysis) [e.g. reanalysis > radiosonde > MSU]. The cooling trend in NCEP-DOE and NCEP-NCAR (-1.0 K/decade) is much lower than any of the other products (-0.3 ~ -0.7 K/decade) over the tropics. The spread in the reanalyses (0.35 K/decade) is around seven times greater than the value in the MSU (0.05 K/decade). The JRA25 shows a noticeable inconsistency compared to the other twelve datasets. In the troposphere, however, a warming trend increases with latitude from south to north with the warmest trend observed in the Arctic The spread increases in the opposing direction with the largest spread found in the Antarctic. It should be noted that the Antarctic shows a cooling trend in all MSUs, RICH, JRA25, MERRA and NCEP-CFSR datasets. The NCEP new reanalysis (e.g. NCEP-CFSR) shows the strongest warming trend in the tropics and the RAOBCORE is the warmest one in the Arctic. (a) NCEP-CFSR NCEP-DOE NCEP-NCAR RAOBCORE RATPAC MERRA HADAT2 JRA25 RSS UAH STAR IUK RICH (b) (c) (d) Inter-comparison of stratospheric temperature (TCH4 ) trends (K/Decade) for the MSU (RSS, UAH, STAR), Radiosonde (RATPAC, HADAT2, UK, RAOBCORE, RICH) and Reanalysis (JRA25, MERRA, NCEP- CFSR, NCEP-NCAR, NCEP-DOE) products for the period of 1979-2006. (a) Trend changes with latitude for each individual dataset; (b)Latitude sections by data source for the trends -- the shaded areas indicated the statistical significance t-test at the 99%. (c) Trend means for each group dataset; (d) Spread for each group dataset. Note that the “total” is MSU + Radiosonde + reanalysis; the “mean” is the global average for all thirteen datasets. Height-latitude distribution of annual zonal-mean temperature trends (K/decade ) from 1989 onwards. Radiosonde: (a) HADAT2, (b) IUK, (c) RAOBCORE, (d) RATPAC, (e) RICH; Reanalysis: (f) NCEP-NCAR, (g) NCEP-DOE, (h) NCEP-CFSR, (i) ERA-40,(j) ERA-interim, (k) MERRA, (L) JRA-25. Shading indicated the statistical significance t-test at the 95% confident level Tropospheric Temperature (Ch2) (a) Reanalyses +Radiosonde Reanalyses NCEP-CFSR NCEP-DOE NCEP-NCAR RAOBCORE RATPAC MERRA HADAT2 JRA25 RSS UAH STAR IUK RICH (b) Radiosonde Reanalyses -Radiosonde (c) (d) Vertical profile of the mean trends and spreads (K/decade) for the global mean temperature from 1989 onwards in (a) total twelve members of reanalyses and radiosondes, (b) seven reanalyses, (c) five radiosonde, (d) the difference between reanalyses and radiosonde Similar to above Figure except for the Tropospheric Temperature (TCH2) Trends. The shaded areas in (b) The shaded areas indicated the statistical significance t-test at the 99%


