Download
1 / 42
420 likes | 487 Views
A New Approach for Accurate Modelling of Medium Access Control (MAC) Protocols. Presenter: Moshe Zukerman ARC Centre for Ultra Broadband Information Networks EEE Dept., The University of Melbourne Presented at EE Dept., City University of Hong Kong, 11 April, 2002

E N D
A New Approach for Accurate Modelling of Medium Access Control (MAC) Protocols Presenter: Moshe Zukerman ARC Centre for Ultra Broadband Information Networks EEE Dept., The University of Melbourne Presented at EE Dept., City University of Hong Kong, 11 April, 2002 Credit: Chuan Foh (EEE, Melbourne)
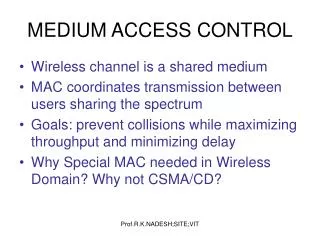
OUTLINE • The big picture • Classical performance models • Ethernet • IEEE 802.3 • How can we get performance statistics for a complicated protocol • Breaking the problem into two: Saturation and SSQ fed by correlated SRD Markovian traffic • Numerical results
Link and Network Design and Dimensioning Performance Evaluation Traffic Prediction Traffic Modelling Traffic Measurements Queueing Theory Simulations and Fast Simulations Formulae in Closed Form Numerical Solutions
Research in Performance Evaluation • Exact analytical results (models) • Exact numerical results (models) • Approximations • Simulations (slow and fast) • Experiments • Testbeds • Deployment and measurements • Typically, 4-7 validate 1-3.
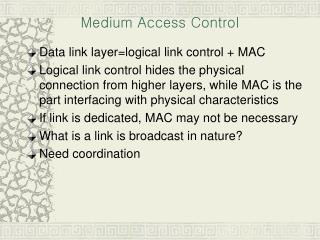
Classical Performance Models Poisson Traffic Model Many simplified assumptions on System/protocol operation Inaccurate results
We want Realistic Traffic Model No simplified assumptions on System/protocol operation Accurate results
Example 1: Ethernet The Ethernet MAC protocol: (1) Carrier Sensed Multiple Access with Collision Detection (CSMA/CD) (2) The Binary Exponential Backoff (BEB) Algorithm
C D E F G time D G G C E E F F Ethernet The Big Bang of E, F & G D time
DetailedAnalysis LAN traffic Served packets CSMA/CD BEB collided packets Ethernet -or - IEEE 802.3
Classical Performance Models Poisson offered load G LAN traffic 1-persistent CSMA/CD Served packets collided packets BEB retransmission Poisson
Example 2: IEEE 802.11 The IEEE 802.11 MAC protocol: (1) Carrier Sensed Multiple Access with Collision Avoidance (CSMA/CA) (2) The Binary Exponential Backoff (BEB) Algorithm
DetailedAnalysis LAN traffic Served packets CSMA/CA BEB collided packets IEEE 802.11
Simplified Performance Models Bernoulli or Poisson offered load G LAN traffic Served packets CSMA/CA collided packets fixed window retransmission BEB
Well, we know how to get: Queueing performance of state dependent Markovian Single Server Queue (SSQ) Performance results without simplified assumptions on System/protocol operation when system is saturated
so, we break the hard problem into two separate easy problems: Queueing performance of a state dependent Markovian SSQ Performance evaluation of the System/protocol operation when system is saturated
From saturation analysis without simplified assumptions on system/protocol operation, we can get: The service rate, given that there are n saturated stations in the system. Then using state dependent Markov Chain analysis, we get: The performance results we are after
State dependent single Server queue State dependent (n) service Markovian SRD arrival process For each n solve MAC under saturation n stations
Source Traffic Arrival Model Phase type distributed transmission time Phase type distributed transmission time Exp. distributed gaps Data frame Data frame time Packet Train of packets Data frame =
Source Traffic Arrival Model A new data frame is generated, it is scheduled for transmission immediately The data frame is transmitted successfully at this point of time Exponentially distributed After an idle period, another new data frame is generated. It is scheduled for transmission immediately time
Another Traffic Model considered:Markov Modulated Poisson Process (MMPP) The number of active stations increases based on MMPP And decreases based on the MAC service process
Now let’s use the simpler problem under saturationto model the service rate
Saturation Traffic n stations arrival departure
Service Process E8 will be chosen
Why E8 is good enough? Let X exp(), E [X] = 1/ X8 E8,X32 E32 bothwith mean 1/ , Var [X] = 1/ 2 Var [X8] =8/(8)2=1/(82) Var [X32] = 32/(32)2=1/(322) Var [X32] = (1/4)Var [X8] = (1/32)Var [X] 2 [X32] = [X8] , 2.82 [X8] = [X]
Why E8 is good enough (cont.)? From M/G/1 mean queue size result: Q: mean queue size : utilization S: SD of the service time distribution S: mean service time
Why E8 is good enough (cont.)? When the SD/mean is small (as for X32), doubling it does not significantly affect queueing performance for small . However, when it is already doubled, multiplying it further by 2.82, affects performance.
Mean delay under different payload sizes: simulation vs. analysis
Mean delay under different date frame distributions: simulation vs. analysis Solid lines: dual fixed data frames Dotted lines: fixed size data frames
Mean delay under different train arrival processes: simulation vs. analysis Mean train size = 24576 bits
Lam’s results overestimate the performance. Our results indicate that the Ethernet protocol will be unstable at 30% for a=0.1 and 75% at a=0.01. Lam’s predictions (Computer Network 4, 1980) are much higher in the two cases. a = the signal propagation delay normalized to the data frame transmission time between any pair of stations. We assume a star network and the distance between any station and the hub (active or passive) is fixed. D/b1= the mean transmission delay normalized to the data frame transmission time. Traffic: Lam’s=Ours=Poisson traffic Data frame size distribution: Lam’s=Ours=fixed Retransmission algorithm: Lam’s=An adaptive retransmission algorithm; Ours=BEB
Conclusion: Accurate MAC performance results under statistical traffic can be achieved by breaking up the original problem into two simpler easier problems:(1) SSQ(2) MAC under saturation