Download
1 / 33
330 likes | 335 Views
ASE profiler or what the hell is going on…. Rev. 08.2016. http://andrewmeph.wordpress.com mailto: andrew.me.ph@gmail.com. Note and disclaimer:.

E N D
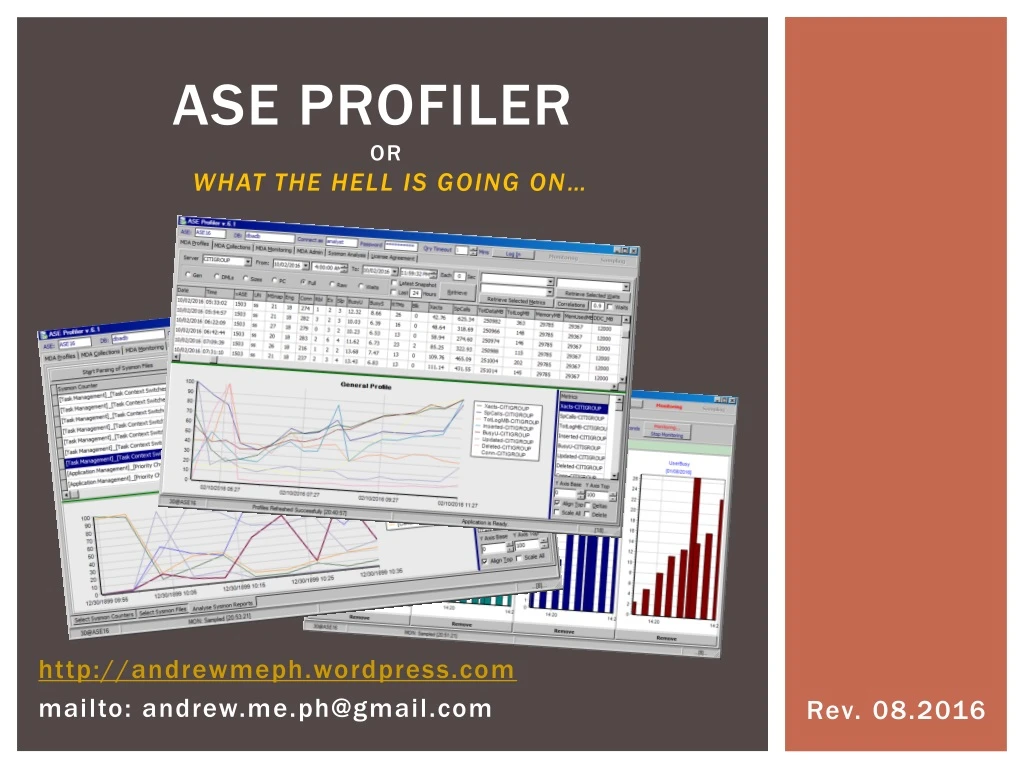
ASE profiler or what the hell is going on… Rev. 08.2016 http://andrewmeph.wordpress.com mailto: andrew.me.ph@gmail.com
Note and disclaimer: • ASE Profiler has ASE in its name. As its name implies it is designed to work with SAP ASE server exclusively. Although designed to work with SAP ASE, the tool has not been designed, tested or, indeed, approved by SAP. The responsibility for what this tool displays rests solely in the domain of its author. The precision of data, however, is impacted by the precision of data in the MDA Tables. • While ASE Profiler is called Profiler it is quite distinct from MSSQL profiler ported with Microsoft SQL Server. As opposed to the latter it does not log into a running DBMS instance profiling execution of the active sessions. Rather ASE Profiler is envisioned as a tool to gradually build historical profile for selected ASE server(s), with an ability to dig instantly into its ASE’s rich MDA infrastructure. As the result, it’s profiling capabilities are twofold: it helps building general performance profile for an ASE server AND it helps collecting detailed performance profile. • The idea behind the tool is simple: the more accessible historical information is available to you the better you will eventually understand ASE instance** you are responsible of. While collecting MDA snapshots of activity of ASE server today is a common practice, presenting it in a unified view, making its collection fully customized and making the task of mining it more accessible is still missing in the ASE market. The tools aims at filling this lacuna. In addition, it differs from all the tools available in the market today in its being able to adjust to the demands of a DBA operating it rather than showing him/her what it is designed to show. As such, the toll is quite unique in what it has to offer.* * The tool is a WIP. Its functionality will evolve over time. It is offered “as is” with not responsibility taken for its impact. You are fully responsible to know what impact collecting MDAs does in your environment and should act accordingly. Test it before you use it. Use it only if you think it fits your environment and will do you no harm. ** Any names displayed throughout presentation are fictional and do not indicate whether the application has been or ever will be used in that environment.
ASE profiler: A Quick info What ASE Profiler can do to you right now… As of this moment, ASE profiler can: • Collect customizable profile of ASE server(s) into centralized repository. • Collect customizable snapshots of ASE MDA tables into centralized repository. • Monitor ASE profile while it is being built. • Make mining into ASE MDAs tables easier. • Make mining into ASE SYSMON Reports easier. • Trigger MDA/Profile collection based on customized set of performance alerts. What it will not do for you at any time: • Solve performance issues or absolve of the need to understand MDA data. It’s like a spade – it is there to fit your hand, not to replace it. What it may do to you if you are not careful enough: • Submerge monitored ASE(s) to excessive load of extracting MDA data.
ASE profiler: an introduction ASE Profiler stores data in an existing ASE server chosen by its user. In order to run first time you will have to select (or create) a database where it will install its framework*. This ASE will henceforth function as MDA Repository. In order to enable ASE Profiler capability to install itself you will have to connect to your MDA Repository with a login that has sa_role and is mapped to dbo in the Repository Database**. After the ASE Profiler infrastructure is set up it is advisable to create a dedicated login to be used with ASE Profiler by its other users and grant it mon_role. If you want the user to be able to add new data to your repository you will have to grant him/her DML rights to the repository DB. This will allow delegating both analytical tasks of mining into MDA data and the task of collection new data to non-DBA functions. ASE Profiler framework consists of a set of tables, views and stored procedures which it uses internally. The main profile repository table is customizable, as is the batch collecting ASE profile snapshots. There is an interface to change the actual layout of the ASE “profile.” The content of full MDA snapshot it customizable as well. * It is advised to install MDA Repository over fast disks (SSD). As data will accumulate over time mining it will take longer. Running it over ASE IMDB would be ideal. MDA Repository database should have enough data cache available to work smoothly and enough storage capacity to accommodate incoming data. ** You have to configure an ODBC connection to your Repository DB to work with this application.
ASE profiler: an introduction As of this moment ASE Profiler has six major operation panes*: • MDA Administration – used to install ASE Profiler infrastructure. In addition, this function presents an interface to collect concise MDA profiles or full collections of MDA tables manually. • MDA Profiles – presents collected ASE profiles over time, raw or in graphs. Allows to correlate various performance aspect. • MDA Collections – presents an interface to mine into collected ASE MDAs. Allows either to inspect and export raw data or run through top N performance heavy-weights tests. Customizable. Furthermore, collected MDA data may be presented in graphs. • MDA Monitoring – offers a capability to see collected MDA profiles as they build over time. • Sysmon Analysis – offers a capability to parse existing SYSMON Reports – export raw data or correlate selected metrics graphically. • MDA Alerts – offers a capability to setup performance alerts and fire alert actions (automatic MDA/Profile collection). * The layout and content of the tool is subject to change. New functionalities may be added it over time. Its interface too may evolve to optimize user experience.
1. MDA Administration MDA Administration is performed using MDA Admin page MDA Admin page allows you to: • Install ASE Profiler framework. • Collect Concise ASE Profiles. • Collect Full ASE MDA Data. • Export Profile Collector for use as an external batch. • Customize ASE Profiles.
MDA Admin: INSTALLATION setup Follow these steps to install ASE Profile infrastructure: • Connect to your repository ASE with sa account (or account with sa_role enabled). • Fill the details of MDA/Profile “snap” server – the login must have create table permissions in “snap temp db” where it installs an auxiliary table/view for Profile Snap-shooting and have mon_role enabled. • Connect to the ASE server you want to start profiling. • Activate “Install … Framework” button. ASE Profiler will install its working tables and stored procedures in Target and Repository ASEs. In addition it will install localcopies of versioned ASE MDA tables in Repository ASE. The operation is logged – its success or failure will be displayed.
MDA Admin: Collect profiles Follow these steps to collect ASE Profile: • Connect to your repository ASE with any account with mon_role enabled. • Fill the details of your “Snap” (source) ASE Server. • Snap Temp DB must point to the database on the source server used during installation step. • The login must have mon_role enabled. • Establish Connection to the Profile Snapshot (source) ASE Server. • Activate “Take New … Snapshot” button to take an instant profile snapshot. • Activate “Take … Snapshot Each” button to have application fire snapshot collection each X minutes. • Select “No Log” to reduce the amount of logging for automatic snapshots. • ASE Profiles will generate new profile record(s) in local MDA Repository. You will need at least two profile snapshots available in order to start seeing existing profile records.
MDA Admin: Collect FULL MDAs Follow these steps to take full ASE MDA Snapshot: • Connect to your repository ASE with any account with mon_role enabled. • Fill the details of your MDA Collection “Snap” (source) ASE Server. • Snap Temp DB must point to the database on the source server used during installation step. • The login must have mon_role enabled. • Establish Connection to the Profile Snapshot (source) ASE Server. • Mark “per-object” statistics to collect systabstats, sysquerymetrics & sysobjects for all user databases. • Activate “Take New … Snapshot” button to take an instant MDA Collection snapshot. • Activate “Take … Snapshot Each” button to have application fire snapshot collection each X minutes. • Select “No Log” to reduce the amount of logging for automatic snapshots. ASE Profiler will generate full* copy of ASE MDAs in local MDA Repository. You will need at least two MDA snapshots available in order to start seeing differential values. Absolute values will be available instantly. * To Filter out user databases or specific MDA tables fill [SKIPMDAS] or [SKIPUSERDB] rubrics in the ini file.
MDA Admin: export batch If you plan to monitor N servers it is advisable to export the Profile Snapshot script and run it as an external batch against all the ASE servers you plan to monitor. Although the application is licensed the script used by the application may be exported and used free of charge. Install the ASE Profiler Framework before running this script manually. • Activate “Export Snapshot” with “Batch” enabled to export the batch for external use. • Activate “Export Snapshot” with “Setup” enabled to export Profile Framework Installation Script – if you plan to modify the default metric layout of your ASE Profiler.
MDA Admin: profile customization It is possible to change the set of ASE metrics chosen for ASE Profile. If you wish to add/remove/modify some of the metrics pre-collected into a Profile you may rewrite both Profile tables and Profile snapshot script. Do exercise caution – some of internal functionality may get broken if you strip too much. Adding new metrics or adjusting existing should cause no issues. • Activate “Export Snapshot” with neither “Batch/Setup” enabled. • Modify the script. • Adjust DDLs for the snapshot tables at both MDA repository and source ASE server if you add/remove metrics. • Activate “Import Snapshot” with neither “Batch/Setup” enabled. • Next profile snapshot will run your customized script. • By setting “[IMPORTSQL] Startup=Yes” in the application ini file the modified script will be loaded each time application starts up thus enabling you to run your own variation of profile collection.
2. MDA PROFILES: who, what & when ASE Profile page allows to start inspecting ASE behavior over time It is possible to inspect data visually and begin to look for trends and correlations as soon as ASE profiles start being collected.
MDA PROFILES: raw data It is possible to see collected profile metrics for each server as: • General overview (top N pre-selected metrics) • DML-based (IUD statistics) • Size-based (overall log growth or data growth) • PC (proc cache metrics such as spinlock contention, PC module distribution) • Full Collection (all metrics – either period-sensitive or as raw values) • Waits (ASE System Waits) The time window may be either set manually (from/to) or as a preset (last N hours or the most recent snapshot). The data may be kept refreshing automatically as new snapshots arrive. ASE Profiler allows you to display raw data selectively and put different metrics onto the same graph.
MDA PROFILES: graphs Right-click on a data cell to start building metric graphs: You may: • Choose a single metric. • Choose all metrics grouped around a particular other metric (say server – data should be sorted fittingly). • Choose every available metric displayed. All metrics may be adjusted to one another or displayed in absolute values (metric values may be added as is or as deltas). All/selected displayed metric values may be refreshed if new data brought onto the screen. Metric may be removed from graph if it’s found to be irrelevant.
3. MDA COLLECTIONS: bring it all Use MDA Collections page to mine into collected MDA data: Each collection gathered is listed in the top left corner (whether using admin tab, through alerts, or using manual collection). Double click the collection represented as server & version will list all available MDA snapshots. For each snapshot it is possible to: • Inspect raw data in each MDA table (use filters if needed). • Get a pre-set Top N players in that snapshot (by CPU, LIO, PIO, Waits, Objects &c). • Write free SQL clause to be executed on the data available in the repository. Available MDA Snapshots Metric data (raw or delta)
MDA COLLECTIONS: Table entry point Focus on particular MDA metric to trace its changes while you were monitoring: E.g., say you want to trace how much data cache space a particular object occupied during your tests and whether it has been pushed in/out of cache by others and how frequently. Select monCachedObject -> filter by ObjectName and DBName -> select the snapshot range -> hit Retrieve…
MDA COLLECTIONS: Table entry point Add this and some other metric you want to correlate to the chart (right click on the displayed data grid -> Add to Chart -> {your selected metric}). If the data displayed are homogenous – you may add all displayed metrics to chart… If the data displayed is grouped by a particular aspect (say different ObjectNames) you may sort data accordingly and add it “grouped” by to the chart…
MDA COLLECTIONS: top n entry point Use a predefined Top N entry point to inspect which Objects/SPIDs had been most salient while you were monitoring: E.g., Hit PIO Button -> right click on most prominent SPID -> ShowSQL (or SPID Metrics) -> you will have a simple way of seeing who done what.* * Ability to display SPID text/plan is based on pipes being enabled and their respective sizes. You may see nothing if the server is not configured to collect it…
MDA COLLECTIONS: TABLE SCANS Inspect Table Scanning Activity: Set Top to 0 and hit the Scan button… …You will see all table scans during the sampling period. …Use SPID->ShowSQL to inspect SQL text for a specific SPID*. * Ability to display SPID text/plan is based on pipes being enabled and their respective sizes. You may see nothing if the server is not configured to collect it…
MDA COLLECTIONS: Per object stats Inspect which Objects were hit hardest: Unset SPID, set delta, hit the Objects button… …You will have a distribution of activity during the sampling period by inserts, update, deletes & operations that will help you to understand which objects were accessed most and in what manner.*
MDA COLLECTIONS: Per object stats Inspect which Objects exerted the highest pressure on DDC: Unset SPID, set delta, hit the Cache button… …You will see which object has been most actively used by its presence in the data cache.
4. MDA monitoring: show it to me • Use MDA Monitoring page to observe incoming ASE Profile: • Collecting Profile Snapshots at regular periods allows you to follow performance of your server over time.* The best way to achieve this is to install ASE Profile Framework, export Profilecollection batch, and run it externally at consistent interval. Few Things to remember: • This is not typical real-time monitoring since ASE Profiler does not connect to the server you monitor. • ASE Profiler works with data it collects (or has collected before) on the Last N principle. • You may select how far back you want to display and how frequently to sample for incoming profile changes. * You may monitor up to 20 servers simultaneously, with up to 10 metrics per server.
5. SysmonanalYsis: retrospective • Use SYSMON ANALYSIS page to parse multiple SYSMON Reports: Parsing SYSMON report files does not substitute the need to read through them carefully. However, using ASE Profiler may alleviate the task of observing trends and comparing changes across multiple reports. • Parsing SYSMONs with ASE Profiler is simple: • Load sample SYSMON report. • Parse it intocounters. • Create a collection of counters that are of interest to you in particular. • Select multiple SYSMON report files you want to parse. • Parse them all. • Export parsed data. • Present data graphically.
Sysmon: create counter collection • Use Select Sysmon Counters tab to build a Sysmon Counter Collection: • Go to “Select SYSMON Counters” tab. • Load sampleSYSMON Report File. • Parse it into counters. • Select a cell you want to see in the parsed report. • Decide if you want to see it PerSec, Count, CPU% &c. • Add Counter. • Repeat the process until you select all the counters you want to collect. • Choose Add Matching capability to add all counters that match your search criteria. • It is advised to save the counter collections for future use. You can create different counter collections using “save counters” and “load” them into application to save time (adjust each collection to a particular ASE version, specific area of interest, specific client, &c).
Sysmon: create counter selection • Use Select Sysmon Files tab to select files you want to parse: • Go to “Select SYSMON Files” tab. • Hit Add SYSMON File(s) button. • Make your selection in the dialog displayed. • Remove any unwanted file from the list.
Sysmon: create counter selection • Use Analyze SYSMON Reports tab to start SYSMON Report parsing: • Go to “Analyze SYSMON Reports” • Hit “Start Parsing” button (Append – to append to the data already displayed). • Export Data or right click to add selected counters to graph.
6. MDA ALERTS: wake me up before… • MDA Alerts page introduces functionality to run automatic performance data collection based on particular set of conditions. The two types of data collection ASE Profiler is capable of at this moment are Profile Snapshot and MDA Snapshot. Follow these steps to use alert functionality: • Setup Alerts. • Setup Alert Actions (optional). • Provide application with login credentials to log into monitored server to perform alert actions. • Activate your alerts.
ALERTS: setup • Use the following steps to setup ASE Profiler Alerts: • Give it a name. • Check which server(s) to monitor. • Check which metric to base on (use UserBusy for CPU Load). • Specify if this metric has absolute values or should take into consideration change over time (Per/Sec). • Setup conditions: • Whether to act on change in metric value when it: • Crosses absolute threshold… • Crosses differential threshold (now/before)… • Crosses differential percentage (ditto)… • The last two may define a depth of previous values and compare against their average… • How to compare values (>,<,<>). • How many occurrences to tolerate before firing an optional action. • Whether to be sensitive to timeframe the alert conditions are met. • Create it. • Decide if you want the alert to fire any action (optional). • Choose which action to fire • Taking Profile Snapshot(s)… • Taking MDA Snapshot(s)… • Specify how often to fire it • Until condition passes? • Fixed N times? • Create it.
ALERTS: Activation • Use Activate Alerts tab to activate your alert collection: • Note: If your alerts fire actions, you must specify how to login to the server(s) from which this action collects performance data. If you give wrong credentials the action will fail (and you will see action application popping up complaining about it…). • Fill in credentials that fit all the server that the application will monitor. • Choose frequency of validating your alerts (and, optionally, firing their actions). • Activate them (all the active alerts will run – disable those you decide not to run). • To test a particular alert manually use Test Selected Alert* (inspect the data upon which it operates selecting Verbose Check checkbox). The actions executed are the same as those you execute from Admin page. The setting for alert actions are the same as the setting for admin actions (including filtering out specific MDA tables or choosing to ignore per-database metrics). • * When alerts run they generate operation log. Keep, minimize, or inspect it later on as desired.
ALERTS: history • Use Alerts History tab to inspect history of your alerts: • Go to Alerts History tab, select server, alert, period (or none to display top 100 lately executed alerts). • Ticking the “active” check box will show you only the alerts whose conditions are currently met (active alerts and their actions). • When alert fires, “Validating” label will turn yellow. When alert generates an action the label will turn red. Clicking the label will bring you to the Alerts page so that you may inspect which alert has fired and on which server.
ALERTS: A word of caution • Alerts must be created with great care to prevent firing thousands of useless alerts which may potentially stress your server. Their conditions and actions too must be carefully crafted. • It’s best to run your alerts for some time without any associated action and learn their history to see if the alerts indeed fire in the situations you would wish to have had more data to inspect retrospectively. • When you are certain the alert you have created fires during the periods of activity that you wish to have been present to observe arm it first with firing additional profile snapshots (run till condition passes). This will give you an opportunity to get more high level overview on the desired period without causing any stress on either monitored server or the repository where you keep you data. • Arm your alerts with full MDA collection action only when you are confident that your alert functions perfectly right. It’s highly advised to study MDA collection impact during the periods of high activity you plan to monitor before arming ASE Profiler with the task to perform MDA collection unattended. • Be careful not to over-collect. MDA data is voluminous. Unless you have ample storage allocated to your ASE Repository and the server where ASE Repository and ASE Profiler operate has ample OS resources, collect your MDA data with care.
ASE profiler: a closing note ASE Profiler has been envisioned as a tool to help ASE DBAs making the most of the monitoring infrastructure of ASE server. ASE comes with an extensive self-monitoring framework which allows to observe server’s performance real-time. Although there are tools that already use this framework – some of them even coming from the same vendor – I have found most of them inconvenient and often quite rigid in the way they present data to the user. The raw data collected by these tools is usually obfuscated and hard to reach. Usually, the interface of each tool stipulates what you see and how you do it. The idea of this tool is to put MDA / Profile data first and to make it fully available to a DBA – either through the customizable interface of the tool of through direct access to MDA data itself. As such, this approach is still unique in its market. The ability to easily correlate different MDA metrics is also yet uncommon. I have been struggling to mine MDA data for years. I hope with this tool you will be able to spend less time and effort collecting data and mining it and more time on what really matter – learning your ASE environment’s DNA. I hope I will have enough time in future to fine tune the original idea and the application interface that it gave birth to. Yours truly…
feedbacks • Feedback and corrections may be either sent directly to andrew.me.ph@gmail.com or posted as comments in the blog space. • The blog is available at http://andrewmeph.wordpress.com. • More presentations/tools are available for download throughout the blog space. • You are welcome to post your own ideas there which may be later transformed into customized tools/feature tests and posted for the benefit of general public.