Download
1 / 14
140 likes | 268 Views
Visualizing Numerical Simulations of Magnetized Stellar Winds, and the Synthesis of Observational Diagnostics. Stephen St. Vincent (Swarthmore, class of 2007) Advisor: Prof. David Cohen.

E N D
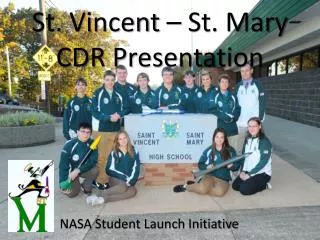
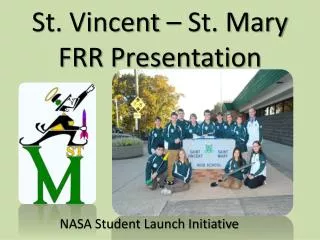
Visualizing Numerical Simulations of Magnetized Stellar Winds, and the Synthesis of Observational Diagnostics Stephen St. Vincent (Swarthmore, class of 2007) Advisor: Prof. David Cohen
We are working with a group doing numerical simulations of magnetized stellar winds, led by Stan Owocki and Asif ud-Doula here at the University of Delaware. • The basic scientific question we are trying to address is how the combined effects of a large scale magnetic field and rapid stellar rotation influence the dynamics of the stellar winds of young, hot, magnetized stars. Can such a Magnetically Channeled Wind Shock (MCWS) model explain: • The strong and hard (i.e. high energy) x-ray emission seen from this class of stars? • Strong x-ray flaring seen in some of these stars? • The rotational modulation of x-rays and optical light? • The signatures of infalling material seen in H-alpha (optical) spectra?
Picture/schematic of MCWS scenario: Babel and Montmerle b/w sketch? Gagne et al. b/w sketch/schematic? Movie showing magnetic field configuration and rotation? And a brief description of the relevant physics (shock heating, confinement).
Sample snapshot from one of Asif’s simulations. Explain that we are working with time-dependent physical quantities (density, temperature, magnetic field, velocity) on a three-dimensional spatial grid. We want to (a) visualize the simulations; (b) characterize the overall properties (e.g. DEM; pinpoint physical location on grid of various phenomena); (c) synthesize observables for comparison with data.
Describe Steve’s part of the project, and how it uses his expertise and interests; Steve’s background as a dual CS-astro major; (some info about the educational program at Swarthmore?); goal of producing well tested and documented code with an intuitive GUI – a package that other members of the group, and future students, can use, even after Steve graduates. Photo of Steve (and other students?) at work in the lab?
Steve takes over: Start with some visualizations – snapshot and movie; not fundamentally different from what Asif himself produces. Are there important differences to point out?
Recap what we want to do – esp. regarding synthesis of diagnostics and calculation of important quantities (often related to observables) that aren’t directly produced from the simulations (examples: line of sight velocity, DEM…maybe explain l.o.s. velocity, Doppler shift, rotation phase dependent (viewing angle dependent) occultation.
Show line of sight velocity map and the associated line profile (snapshots).
Show movies of the same. Maybe one of those four-panel movies.
Show graphical user interface – snapshot/screen shot? Or even interactively use it live? Discuss/comment on your educational experience with GUIs. Where did you learn to do this? Reading IDL manual? In a CS class? A CS project?
Show website – with movies and snapshots, but also log, etc. The research website as paradigm for organizing a student-based research project should be of broad interest to the audience.
Flash some of your documentation up on the screen; briefly discuss how you’re organizing this “user guide.” We could mention that one of the goals of the project is to be able to apply your code to simulations run by other people, using other codes (e.g. Rich Townsend’s RRM simulations). So, usability is an issue.
Maybe close with some specific problem you’re tackling: H-alpha emission profiles as a function of phase? DEM from centrifugal breakout event in simulation with rotation? Processing Asif’s new quadrupole simulation? …include a relevant image or movie. Mention that you’ll be presenting your work at the AAS meeting in Seattle in January.