Download
1 / 1
10 likes | 115 Views
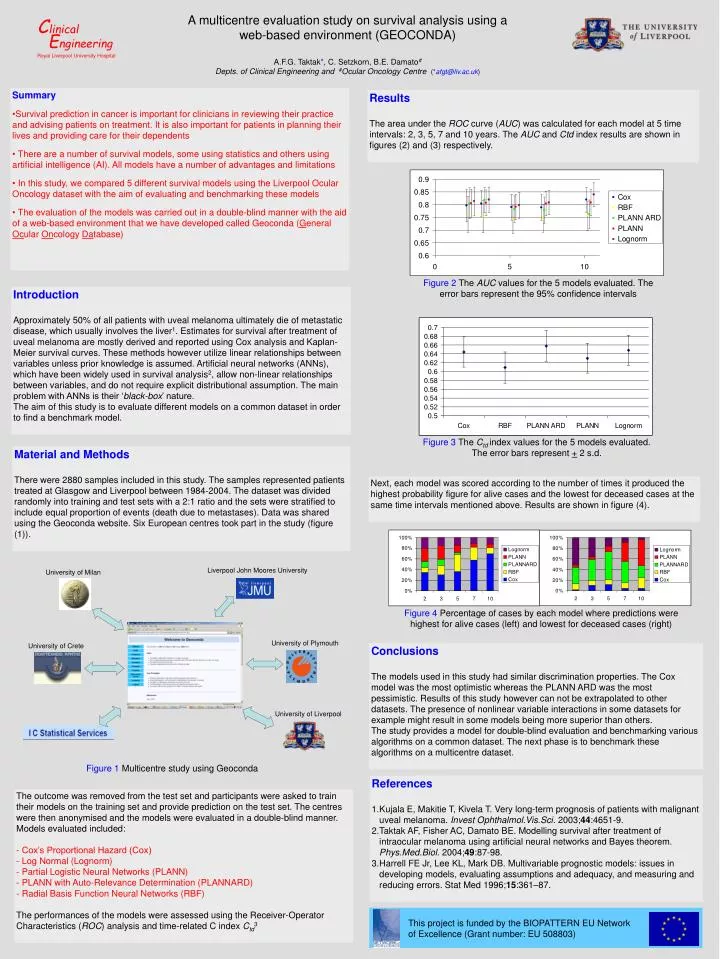
C linical. E ngineering. Royal Liverpool University Hospital. Liverpool John Moores University. University of Milan. University of Plymouth. University of Crete. University of Liverpool. A multicentre evaluation study on survival analysis using a web-based environment (GEOCONDA)

E N D
Clinical Engineering Royal Liverpool University Hospital Liverpool John Moores University University of Milan University of Plymouth University of Crete University of Liverpool A multicentre evaluation study on survival analysis using a web-based environment (GEOCONDA) A.F.G. Taktak*, C. Setzkorn, B.E. Damato# Depts. of Clinical Engineering and #Ocular Oncology Centre (*afgt@liv.ac.uk) • Summary • Survival prediction in cancer is important for clinicians in reviewing their practice and advising patients on treatment. It is also important for patients in planning their lives and providing care for their dependents • There are a number of survival models, some using statistics and others using artificial intelligence (AI). All models have a number of advantages and limitations • In this study, we compared 5 different survival models using the Liverpool Ocular Oncology dataset with the aim of evaluating and benchmarking these models • The evaluation of the models was carried out in a double-blind manner with the aid of a web-based environment that we have developed called Geoconda (General Ocular Oncology Database) Results The area under the ROC curve (AUC) was calculated for each model at 5 time intervals: 2, 3, 5, 7 and 10 years. The AUC and Ctd index results are shown in figures (2) and (3) respectively. Figure 2 The AUC values for the 5 models evaluated. The error bars represent the 95% confidence intervals Introduction Approximately 50% of all patients with uveal melanoma ultimately die of metastatic disease, which usually involves the liver1. Estimates for survival after treatment of uveal melanoma are mostly derived and reported using Cox analysis and Kaplan-Meier survival curves. These methods however utilize linear relationships between variables unless prior knowledge is assumed. Artificial neural networks (ANNs), which have been widely used in survival analysis2, allow non-linear relationships between variables, and do not require explicit distributional assumption. The main problem with ANNs is their ‘black-box’ nature. The aim of this study is to evaluate different models on a common dataset in order to find a benchmark model. Figure 3 The Ctdindex values for the 5 models evaluated. The error bars represent + 2 s.d. Material and Methods There were 2880 samples included in this study. The samples represented patients treated at Glasgow and Liverpool between 1984-2004. The dataset was divided randomly into training and test sets with a 2:1 ratio and the sets were stratified to include equal proportion of events (death due to metastases). Data was shared using the Geoconda website. Six European centres took part in the study (figure (1)). Next, each model was scored according to the number of times it produced the highest probability figure for alive cases and the lowest for deceased cases at the same time intervals mentioned above. Results are shown in figure (4). Figure 4 Percentage of cases by each model where predictions were highest for alive cases (left) and lowest for deceased cases (right) Conclusions The models used in this study had similar discrimination properties. The Cox model was the most optimistic whereas the PLANN ARD was the most pessimistic. Results of this study however can not be extrapolated to other datasets. The presence of nonlinear variable interactions in some datasets for example might result in some models being more superior than others. The study provides a model for double-blind evaluation and benchmarking various algorithms on a common dataset. The next phase is to benchmark these algorithms on a multicentre dataset. Figure 1 Multicentre study using Geoconda • References • Kujala E, Makitie T, Kivela T. Very long-term prognosis of patients with malignant uveal melanoma. Invest Ophthalmol.Vis.Sci. 2003;44:4651-9. • Taktak AF, Fisher AC, Damato BE. Modelling survival after treatment of intraocular melanoma using artificial neural networks and Bayes theorem. Phys.Med.Biol. 2004;49:87-98. • Harrell FE Jr, Lee KL, Mark DB. Multivariable prognostic models: issues in developing models, evaluating assumptions and adequacy, and measuring and reducing errors. Stat Med 1996;15:361–87. • The outcome was removed from the test set and participants were asked to train their models on the training set and provide prediction on the test set. The centres were then anonymised and the models were evaluated in a double-blind manner. Models evaluated included: • Cox’s Proportional Hazard (Cox) • Log Normal (Lognorm) • Partial Logistic Neural Networks (PLANN) • PLANN with Auto-Relevance Determination (PLANNARD) • Radial Basis Function Neural Networks (RBF) • The performances of the models were assessed using the Receiver-Operator Characteristics (ROC) analysis and time-related C index Ctd3 This project is funded by the BIOPATTERN EU Network of Excellence (Grant number: EU 508803)