Download
1 / 22
220 likes | 319 Views
Experimental Design and Setup. Experimental Design. What is the question?. Which experiments will give the answer?. How many replicates do we need?. Array Setup and Evaluation. By H. Bjørn Nielsen. Choice of technology Setting up a microarray Control spots Evaluation of an array setup.

E N D
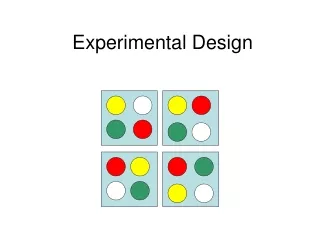
Experimental Design What is the question? Which experiments will give the answer? How many replicates do we need?
Array Setupand Evaluation By H. Bjørn Nielsen • Choice of technology • Setting up a microarray • Control spots • Evaluation of an array setup Spotted Affymetrix
Choice of Technology Affymetrix or spotted arrays • Costs • Flexibility • Data Quality • Required material Affymetrix Spotter
Choice of Technology Costs • Facility setup cost • Equipment • Affymetrix USD 250,000 • Spotted arrays USD 70,000 + ( USD 20 pr. oligo) • Man-hours • Spotted arrays 2-6 Months • Affymetrix 1-2 weeks • Costs after setup • Cost pr. experiment • Affymetrix USD 500 (chip) + 200 (sample prep.) • Spotted arrays USD 30-50 (slide, 4000 spots) + 70 (sample prep.) • Cost pr. spot / transcript • Spotted arrays USD 0.10 / 0.10 • Affymetrix USD 0.003 / 0.04-0.07
Choice of Technology Flexibility • Flexibility • To design custom arrays • - Spotted arrays > Affymetrix • To re-design arrays • -Affymetrix offers a series of pre-designed arrays, • but custom designs are expensive • -Spotted arrays are expensive to re-design
Choice of Technology Data quality • Data Quality • Reproducibility of data (Pearson correlation) • Affymetrix 0.95 • Spotted arrays 0.80-0.95 (highly variable) • Sensitivity • Affymetrix >1:100,000 (linearity) (Affymetrix.com) • Spotted (oligos) 1:300.000 (linearity) (Ramakrishnan et al. 2002) • Specificity • Most studies show: decreased specificity with oligonucleotide length • i.e. 50mers gives false signal down to 75% permutation • 30mers down to 90%. (Kane et. al.2000; Ramakrishnan et al. 2002)
Choice of Technology Required materials • Required material • Affymetrix A pre-designed chip from Affymetrix • Spotted oligonucleotide Sequence information • Spotted cDNA cDNA library
comparisons Array technology
Array layout considerations - What collection of genes do we want to measure What kind of information are we looking for How are we going to normalize the data afterwards Which controls do we need/want
Oligonucleotide array Oligonucleotides synthesis Purified (HPLC) Normalize concentration Dilute in buffer (DMSO/SSC) Spot onto solid surface by array robot Bind to surface setup Typically don by external company
cDNA array setup • Collect relevant clones • Produce cDNA library, • sequence the clones • and re-array • PCR • Product purification and control (gel) • Dilute in buffer (DMSO/SSC) • Spot on solid surface • Bind to surface
Aspergillus oryzae array example
Control spots A. oryzae example All controls are printed in each quadrant of the array i.e. by each of four print pins Incl. controls for Local and global reproducibility Control for slide saturation “Housekeeping” genes Spike-in controls Negative controls Pin washing controls Non-specific binding PCR primer binding Vector binding (pYes) Poly-A control
Control field A A. oryzae example Gamma-Actin: 100% 50% 25% 12.5% 6% 3% Glyceraldehyde-3-Phosphate Dehydrogenase H2O 50% DMSO Empty Poly-A 100% DMSO pYes vector PCR mix + primer Salmon sperm DNA
Spot saturation Saturated spots (ideal) 100 50 25 12,5 6 3 A. oryzae example In reality
Local vs. Global Variation Glyceraldehyde-3-Phosphate Dehydrogenase Local std Global std
Control field B Alpha-Amylase Ca-Indep. Phos. Lipase Actin-Rela. Prot. Tubulin Alpha Tubulin Alpha Fibrin DNA-Dependent RNA Polymerase II 40S Ribosomal Prot. Galactanase H.i Gamma-Actin Histone H2A Arabidopsis CAB Arabidopsis RCA Beta-Actin 60S Ribosomal Protein Arabidopsis rbcL ER Chaperone BIP Human COT-1 40S Ribosomal Golgi Memb. Prot.-Sort Prot. Tubulin Beta TFIID Glyceraldehyde 3-P. Dehydrogenase Spindel Assembl. Checkpoint Prot. A. oryzae example
Directly or Indirectly 1 2 1 2 3 3 4 4 comparable data Absolute Indirectly
Directly or indirectly comparable data Indirect ratio: Mean (gali+/ wti) Direct ratio: Sgali+/ Swti
Reproducibility - same sample in both channels Log2(Ratio) Log2(intensity)
Is Data Gausian Glyceraldehyde-3-Phosphate Dehydrogenase Sample Quantiles Theoretical Gaussian Quantiles Q-Q plot