Download
1 / 1

E N D
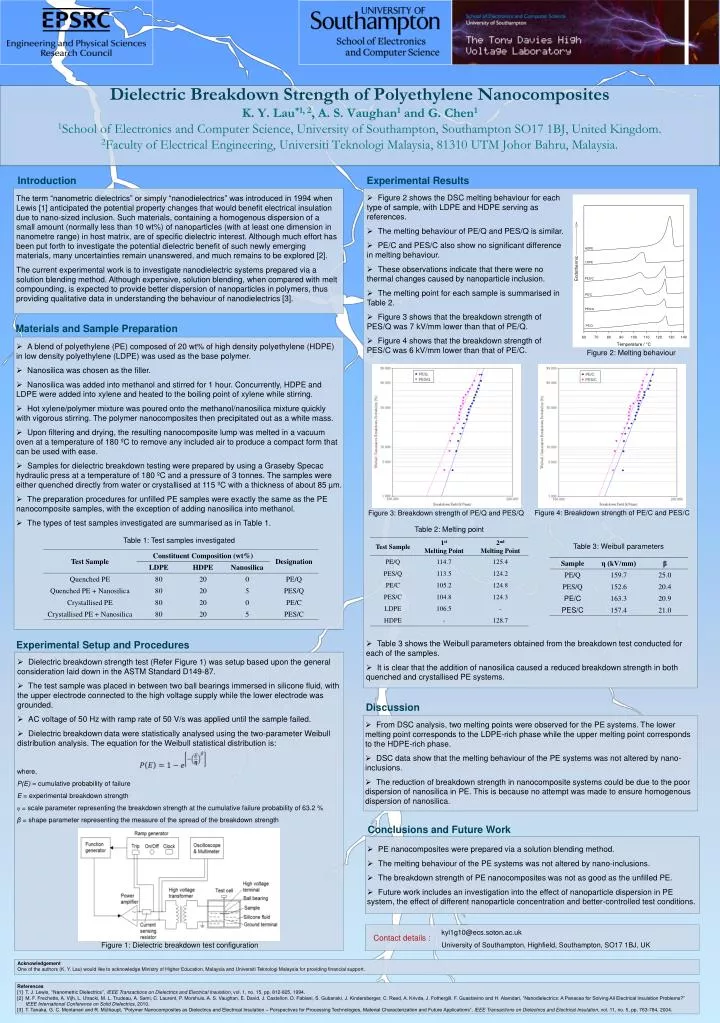
Dielectric Breakdown Strength of Polyethylene NanocompositesK. Y. Lau*1, 2, A. S. Vaughan1 and G. Chen11School of Electronics and Computer Science, University of Southampton, Southampton SO17 1BJ, United Kingdom.2Faculty of Electrical Engineering, Universiti Teknologi Malaysia, 81310 UTM Johor Bahru, Malaysia. Introduction Experimental Results • Figure 2 shows the DSC melting behaviour for each type of sample, with LDPE and HDPE serving as references. • The melting behaviour of PE/Q and PES/Q is similar. • PE/C and PES/C also show no significant difference in melting behaviour. • These observations indicate that there were no thermal changes caused by nanoparticle inclusion. • The melting point for each sample is summarised in Table 2. • Figure 3 shows that the breakdown strength of PES/Q was 7 kV/mm lower than that of PE/Q. • Figure 4 shows that the breakdown strength of PES/C was 6 kV/mm lower than that of PE/C. The term “nanometric dielectrics” or simply “nanodielectrics” was introduced in 1994 when Lewis [1] anticipated the potential property changes that would benefit electrical insulation due to nano-sized inclusion. Such materials, containing a homogenous dispersion of a small amount (normally less than 10 wt%) of nanoparticles (with at least one dimension in nanometre range) in host matrix, are of specific dielectric interest. Although much effort has been put forth to investigate the potential dielectric benefit of such newly emerging materials, many uncertainties remain unanswered, and much remains to be explored [2]. The current experimental work is to investigate nanodielectric systems prepared via a solution blending method. Although expensive, solution blending, when compared with melt compounding, is expected to provide better dispersion of nanoparticles in polymers, thus providing qualitative data in understanding the behaviour of nanodielectrics [3]. Materials and Sample Preparation • A blend of polyethylene (PE) composed of 20 wt% of high density polyethylene (HDPE) in low density polyethylene (LDPE) was used as the base polymer. • Nanosilica was chosen as the filler. • Nanosilica was added into methanol and stirred for 1 hour. Concurrently, HDPE and LDPE were added into xylene and heated to the boiling point of xylene while stirring. • Hot xylene/polymer mixture was poured onto the methanol/nanosilica mixture quickly with vigorous stirring. The polymer nanocomposites then precipitated out as a white mass. • Upon filtering and drying, the resulting nanocomposite lump was melted in a vacuum oven at a temperature of 180 ºC to remove any included air to produce a compact form that can be used with ease. • Samples for dielectric breakdown testing were prepared by using a Graseby Specac hydraulic press at a temperature of 180 ºC and a pressure of 3 tonnes. The samples were either quenched directly from water or crystallised at 115 ºC with a thickness of about 85µm. • The preparation procedures for unfilled PE samples were exactly the same as the PE nanocomposite samples, with the exception of adding nanosilica into methanol. • The types of test samples investigated are summarised as in Table 1. Figure 2: Melting behaviour Figure 4: Breakdown strength of PE/C and PES/C Figure 3: Breakdown strength of PE/Q and PES/Q Table 2: Melting point Table 1: Test samples investigated Table 3: Weibull parameters Experimental Setup and Procedures • Table 3 shows the Weibull parameters obtained from the breakdown test conducted for each of the samples. • It is clear that the addition of nanosilica caused a reduced breakdown strength in both quenched and crystallised PE systems. • Dielectric breakdown strength test (Refer Figure 1) was setup based upon the general consideration laid down in the ASTM Standard D149-87. • The test sample was placed in between two ball bearings immersed in silicone fluid, with the upper electrode connected to the high voltage supply while the lower electrode was grounded. • AC voltage of 50 Hz with ramp rate of 50 V/s was applied until the sample failed. • Dielectric breakdown data were statistically analysed using the two-parameter Weibull distribution analysis. The equation for the Weibull statistical distribution is: Discussion • From DSC analysis, two melting points were observed for the PE systems. The lower melting point corresponds to the LDPE-rich phase while the upper melting point corresponds to the HDPE-rich phase. • DSC data show that the melting behaviour of the PE systems was not altered by nano-inclusions. • The reduction of breakdown strength in nanocomposite systems could be due to the poor dispersion of nanosilica in PE. This is because no attempt was made to ensure homogenous dispersion of nanosilica. where, P(E) = cumulative probability of failure E = experimental breakdown strength η = scale parameter representing the breakdown strength at the cumulative failure probability of 63.2 % β = shape parameter representing the measure of the spread of the breakdown strength Conclusions and Future Work • PE nanocomposites were prepared via a solution blending method. • The melting behaviour of the PE systems was not altered by nano-inclusions. • The breakdown strength of PE nanocomposites was not as good as the unfilled PE. • Future work includes an investigation into the effect of nanoparticle dispersion in PE system, the effect of different nanoparticle concentration and better-controlled test conditions. kyl1g10@ecs.soton.ac.uk University of Southampton, Highfield, Southampton, SO17 1BJ, UK Contact details : Figure 1: Dielectric breakdown test configuration Acknowledgement One of the authors (K. Y. Lau) would like to acknowledge Ministry of Higher Education, Malaysia and Universiti Teknologi Malaysia for providing financial support. References [1] T. J. Lewis, ‘‘Nanometric Dielectrics’’, IEEE Transactions on Dielectrics and Electrical Insulation, vol. 1, no. 15, pp. 812-825, 1994. [2] M. F. Frechette, A. Vijh, L. Utracki, M. L. Trudeau, A. Sami, C. Laurent, P. Morshuis, A. S. Vaughan, E. David, J. Castellon, D. Fabiani, S. Gubanski, J. Kindersberger, C. Reed, A. Krivda, J. Fothergill, F. Guastavino and H. Alamdari, “Nanodielectrics: A Panacea for Solving All Electrical Insulation Problems?” IEEE International Conference on Solid Dielectrics, 2010. [3] T. Tanaka, G. C. Montanari and R. Mülhaupt, “Polymer Nanocomposites as Dielectrics and Electrical Insulation – Perspectives for Processing Technologies, Material Characterization and Future Applications”, IEEE Transactions on Dielectrics and Electrical Insulation, vol. 11, no. 5, pp. 763-784, 2004.