Download
1 / 33
330 likes | 340 Views
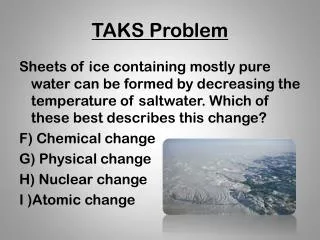
Turbo TAKS. Week 1 Lesson 1: Graphing Lesson 2: Scientific Method Lesson 3: Lab Safety/ Equipment Lesson 4: Predicting Trends in Data. Lesson 1: Graphing. Line Graph. Line graphs are used when one variable (independent) affects another, which is the dependent variable.

E N D
Turbo TAKS Week 1 Lesson 1: Graphing Lesson 2: Scientific Method Lesson 3: Lab Safety/ Equipment Lesson 4: Predicting Trends in Data
Line Graph • Line graphs are used when one variable (independent) affects another, which is the dependent variable. • Useful for predicting trends
What’s your conclusion? Is minimum wage increasing or decreasing over time?
Bar Graph • The data for this graph are non-numerical and discrete for at least one variable. There are no dependent and independent variables. Axes may be reversed to give a graph with the categories on the x axis. • Bar graphs can therefore be drawn horizontally or vertically. This type of graph is very useful for comparing two or more similar items.
Pie Graph (Circle graph) • As with bar graphs, pie graphs are used when the data for one variable are discrete (categories) and the data for the other variable are in the form of counts (percentages or proportions) • A circle is divided according to the proportion of counts in each category. • Not suitable for data sets with a very large number of categories (more than 6)
Should our school require students to wear uniforms? (student survey)
Music Preference for Young Adults (what’s your conclusion?)
Scientific Method Procedures • Observation • The foundation of the scientific method • Leads to a question regarding the event or characteristic • Hypothesis • Is an “educated guess” • It is a tentative cause and effect statement. • Has to be testable • Is rejected or accepted at the conclusion of an experiment
Terminology • Hypothesis: a possible answer to a scientific question (Q: “How will studying affect my test score?” Hypo: “If I study for… then my test score will…”) • Prediction: states the expected outcome of an experiment designed to test the hypothesis (“My test score will…”) • Inference: a logical interpretation based on prior knowledge and experience (“I have always done poorly in science, so I will do poorly this time too.”)
Scientific Method Procedures • Experiment • Experiments must be repeatable and reproducible. • dependent variable - this will be the single observation, or the result we will be observing. • independent variable - this will be the single variable we elect to manipulate. • controlled variables - these are factors that we will keep constant (“keep controlled”) during the experiment, so that they do not affect the dependent variable.
Scientific Method Procedures • Collect/ Analyze Data • Always report ALL results (the good, the bad, and the ugly!) • Look for patterns in the data • Conclusion • WHAT HAPPENED AND WHY?
Lesson 3: Lab Safety/ Equipment It’s better to be safe than sorry!
Appropriate Clothing/ Dress • ALWAYS WEAR GOGGLES AND APRONS when told to do so! • Long hair tied back • Closed toe shoes
Accidents, Injuries, Equipment Breaks • Report any accident or injury to your teacher IMMEDIATELY! • If you cannot notify the teacher because of your injury – have your lab partner tell the teacher!
Safety with Gases or Inhalants • Do not inhale any gas or vapor unless directed to do so by your teacher. • WAFT any scent to your nostrils to ensure that you do not destroy the mucus membranes of your respiratory system. • Handle materials that emit vapors or gases in a fume/ vent hood.
Chemical Storage • Store chemicals in a clean, dry place. • NEVER put used chemicals back into the original container. This eliminates contamination.
ALWAYS POUR ACID SLOWLY INTO WATER! NOT water into acid!
Use Common Sense • When using scalpels, sharp probes, and knives do not cut objects while holding them in your hand. • Cut objects on a suitable work surface. Always cut in a direction away from your body. • Use tongs or insulated/ thermal holders when handling heated objects. • Never point the open end of a test tube at yourself or others when heating it
The 4 C’s • Caustic: capable of burning, corroding, or destroying living tissue. • Carcinogen: any substance or agent that tends to produce a cancer • Corrosive: having the quality of corroding or eating away • Combustible: capable of catching fire and burning
Hazard Ratings • Rates hazards from 0-4 • 0 minimal • 1 slight • 2 hazardous • 3 extremely hazardous • 4- deadly • Red- Fire • Yellow- Reactivity • Blue - Health Risk • White- Special Info
Measuring Volume • Use a graduated cylinder • Read the bottom of the meniscus • For an irregular object, use volume displacement.
Measuring Mass • Use an electronic (digital) balance or triple beam balance
Other measurements • Temperature is measured with a thermometer. • pH is measured with litmus paper or a pH meter. • Distances are measured with a ruler or a meter stick. (There is a ruler on your TAKS formula chart.)
Lesson 4: Predicting Trends in Data • Test Taking Tip: When you are drawing a conclusion or predicting a trend in the data, you have to base your answer on the data given. This means that they have to give you the answer! Do NOT rely on anything but what is given to you. If an answer choice is about something not mentioned or goes against the given data, it is NOT the right answer.
Let’s try: According to the data in the table, about how far can a spring be expected to stretch when a force of 3.92 N is applied? A 10.5 cm B 13.6 cm C 14.0 cm D 17.3 cm
Answer: C 14.0 cm Reasoning: each time the force goes up .98, then the spring is stretched 3.5 cm. 10.5 + 3.5 = 14.0
The diagram illustrates how some characteristics of the horse have changed over time. Along with the difference in size, what is another anatomical difference between the modern horse and its ancestors? A The structure of the tooth has been adapted for eating meat. B The size of the molars has decreased. C The length of the forefoot has decreased. D The number of toes has decreased.
Answer: D # of toes decreased Reasoning: On left side of table, time goes from the bottom (being a long time ago) to the top (recent time). Looking at the pictures, you can mark off answers A, B, and C.