Download
1 / 16
160 likes | 349 Views
Improvement of power curve measurement with lidar wind profiles. R Wagner, M Courtney, J Gottschall , P Lindelöw-Marsden EWEC 2010 20-23 April 2010 Warsaw, Poland. Outline. Motivation Experimental setup Classification of wind profiles Kinetic energy flux approximation

E N D
Improvement of power curve measurement with lidar wind profiles R Wagner, M Courtney, J Gottschall, P Lindelöw-Marsden EWEC 2010 20-23 April 2010 Warsaw, Poland
Outline • Motivation • Experimental setup • Classification of wind profiles • Kinetic energy flux approximation Definition of equivalent wind speed • Power curve uncertainty • (*) Different configurations of profile measurements • Conclusions
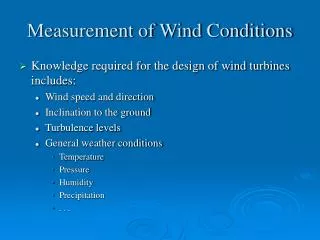
Motivation • cf. IEC 61400-12-1 standard • only wind speed measurement • at hub height • but vertical wind speed profile is relevant (!) • to be measured by (ground-based) lidar profiler
Experimental Setup Experiment perfromed at Høvsøre test site, multi-MW test turbine. N • Preparation of lidar data • Filters: • wind direction; • no rain; • lidar signal availability 100% at all heights; • turbine status=1.
Classification of wind profiles RSS<0.1 ( Group 1) RSS>0.1 ( Group 2)
Effect of ignoring the wind speed shearon the power performance measurement 2 different power curves for the 2 groups of profiles
Kinetic energy flux approximation Kinetic energy in the wind (assuming horizontal homogeneity): First approximation (“constant” profile): Better approximation (measured profile): Wrong estimation of the kinetic energy flux because speed shear is ignored.
Using the equivalent wind speed Same power curve for the two groups of profiles.
Consequence on the unified dataset Reduction of the scatter
Power curve uncertainty (Ref.: IEC 61400-12-1 / ”GUM”) The equivalent wind speed method reduces the category A uncertainty. • Category B uncertainty in wind speed measurements: • comparable to the lidar at hub height; • higher than cup anemometer (by definition).
Power curve uncertainty Combined uncertainty in power curve: similar to lidar at hub height uncertainty due to shear not accounted for in the power curve as a function of hub height wind speed.
(*) Number and position of wind speed measurement heights 3 measurements 5 measurements 9 measurements
(*) Number and position of wind speed measurement heights A significant reduction of the scatter is obtained with wind speed measurements at 3 heights.
(*) Number and position of wind speed measurement heights Profile extrapolation from 2 or 3 speed measurements below hub height No reduction of the scatter !
Conclusions • There is a significant effect of ignoring the wind speed shear on power performance measurement (especially for non power law profile) – as done in IEC 61400-12-1. • We observe a reduction of scatter with equivalent wind speed (as shear normalization procedure); • Leading to more repeatable power curves. • Successful experimental application of the method with a lidar. • (*) Reduction of scatter can only be obtained with wind speed measurements at (at least) 3 measurement heights including one height above hub height.