Download
1 / 19
190 likes | 374 Views
Wind Power. By: Greg Fisher. Turbine. Wind turns propellers surrounding a rotor. Rotor spins a generator to create electricity. Uses. Electricity grid 1 MW Single home or building 5-15 KW rating for home. . Wind Power Maps. Darker areas indicate more wind.

E N D
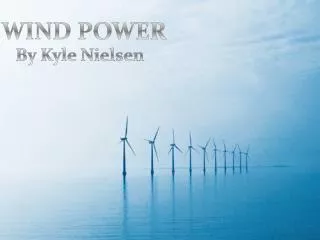
Wind Power By: Greg Fisher
Turbine • Wind turns propellers surrounding a rotor. • Rotor spins a generator to create electricity
Uses • Electricity grid • 1 MW • Single home or building • 5-15 KW rating for home.
Wind Power Maps Darker areas indicate more wind
Choice Energy Wind power • Started by Columbia River PUD • Purchase electricity from wind power • Supports future renewable energy development
Klondike • 16 1.5 MW turbines • Enough to power 6,126 homes
Condon • 83 600 kW turbines • Enough to power 10,513 homes
Stateline • 399 660 kW turbines • Enough to power 26,500 homes
Hydro and Wind Balance • Existence of dams creates logistical issues • Dams are reliable • Wind storms cause excess wind energy • Divert water around dams.
Impacts on Fish • Wind storm create electricity surge • Dams forced to reroute water in a harmful way to fish
Impacts on Bats • Barotrauma is deadly to bats • Deadlier to bats than birds
Impact on Birds • Very limited • Millions killed by house cats per year • Only thousands per year by turbines
Future of Wind Energy • North Dakota and Texas have greatest potential • Washington is nearing max with potential capacity at 3740 MW and current capacity at 1575.38 MW
Existing Wind power • Texas is in the lead • 8361.18 MW currently • 1095.55 MW in production • 136,100 MW potential
Costs • Wind: 5-6.4 cents per kWh* • Hydro: 4-4.5 cents per kWh • Geo: 3.3-3.9 cents per kWh* • Nuclear: 4 cents per kWh • Coal: 2.6 cents per kWh • * taken from geothermal power website
A few references • http://www.awea.org/projects/ • http://www1.eere.energy.gov/windandhydro/wind_animation.html • http://www.timesonline.co.uk/tol/news/environment/article4608418.ece • http://www.oregonlive.com/business/index.ssf/2009/07/wind_power_throws_a_curve_at_t.html • http://heraldnet.com/article/20090727/NEWS03/707279952 • http://www.windpowermaps.org/windmaps/windmaps.asp • http://www.crpud.net/residential/choiceenergy