Download
1 / 18
190 likes | 321 Views
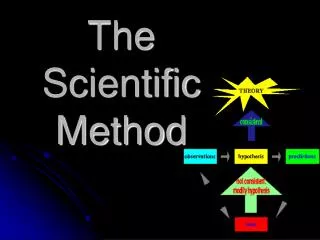
The Scientific Method. What is the scientific method?. The scientific method is a series of steps that scientists use to answer questions about the world around them. 1. Make An Observation.

E N D
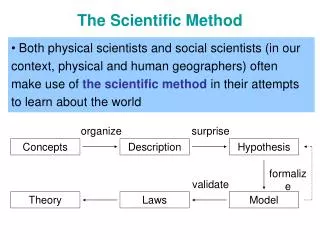
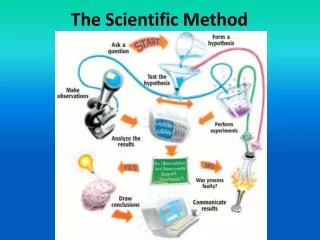
What is the scientific method? • The scientific method is a series of steps that scientists use to answer questions about the world around them.
1. Make An Observation • An observation is information collected by using your senses (sight, touch, smell, hear, but NOT taste) • An inference is an opinion or conclusion based on your observations.
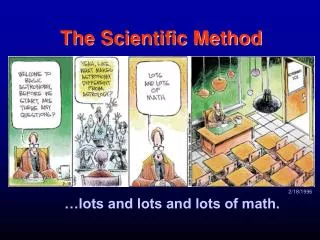
Observation vs. Inference • Give one observation from the cartoon. • Give one inference from the cartoon
Observation vs. Inference • Give one observation from the cartoon. • Give one inference from the cartoon
2. Ask a Question • A problem is a question that scientists ask about the world around them. • Example: Does the height water is dropped from dropper affect the distance the water spreads out? • A variable is something that changes in a situation • Examples: height dropped from, water spread
There are two types of variables • An Independent variable is a variable you change on purpose to see what will happen. • Example: Independent variable: the height I drop the water from • A dependent variable is a variable that change because of what you did. • Example: Dependent variable: the distance the water spreads out on the paper
3. Form an Hypothesis • An hypothesis is a statement based upon your observations that predicts the answer to your original question. • It contains both the independent and dependentvariables. • Example: If I drop the water from a dropper at a higher height, then the water will spread out farther.
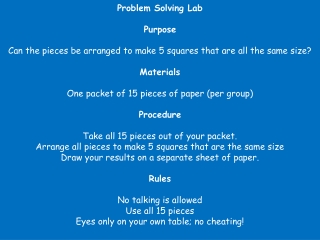
4. Experiment • An experiment is a planned way to test an hypothesis. • It contains two groups: an experimental group and a constant group • The experimental group is the one you change the independent variable • The constant group stays the same • You can only change one variable at a time
Materials Needed • Materials are whatever you will need to complete your experiment • Example: Dropper, Colored Water, Table, Ruler, Paper to Measure Water Spread, Paper with data table, Pencil, Graph Paper, Calculator, Team, Paper Towels (to clean up afterwards)
Procedure • A procedure is the step by step process you will use to carry out the lab activity • Example: • Squeeze the dropper bulb and place the open end in the colored water. • Release the bulb to fill the dropper • Select one person to drop the water. • Have the person hold their right hand out with the dropper at a height of 6 inches. • While seated, squeeze out one drop of colored water onto a piece of white paper on the table. • Measure the width of the distance the colored water spread out…
5. Data Analysis • Data is information collected during an experiment • This data is usually in chart form and turned into graphs • Data analysis is when information from an experiment is studied closely to learn if your original hypothesis was correct
Data Observations • Qualitative data lists what our senses detected during the experiment • Quantitative data lists numbers we collected during the experiment • A chart is a simple listing of data obtained during an experiment
Why do we use graphs? • Graphs help us see patterns in quantitative data • There are three basic kinds of graphs: • Bar Graphs • Pie Graphs • Line Graphs
Bar Graphs • Bar graphs are used to compare many items at the same time • When are students absent the most?
Pie Graphs • Pie graphs are used to compare the parts of a whole • What is most of his trash?
Line Graphs • Line graphs are used to show a relationship between two variables. • As time has passed, what has happened to the amount of whole milk?
6. Draw Conclusions & Share I learned • A conclusion tells what you learned from the experiment and if the data you collected supports your original hypothesis. …