Download
1 / 32
320 likes | 684 Views
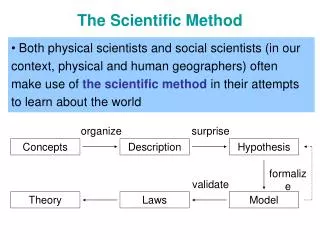
The Scientific Method. Chapter 1. Overview. What is Science? The Scientific Method From Hypothesis to Theory. What is Science?. The goal of science is to understand natural phenomena 2 types of science: Discovery science Hypothesis-based science. Four-eyed butterfly fish.

E N D
The Scientific Method Chapter 1
Overview What is Science? The Scientific Method From Hypothesis to Theory
What is Science? The goal of science is to understand natural phenomena 2 types of science: • Discovery science • Hypothesis-based science Four-eyed butterfly fish
Discovery Science Describes nature Uses inductive reasoning Observations used to infer conclusions (but no complete certainty as to validity) e.g. This red jellybean tastes like cherry. Thus, all red jellybeans taste like cherry. = ?
Hypothesis-Based Science Uses deductive reasoning Previously-known premises used to form conclusions (as long as premises are correct, conclusion will be too) e.g. Dogs are mammals. All mammals have hair or fur. Thus, all dogs have hair or fur.
Critical Thinking Using data and facts to make inferences, draw conclusions, solve problems, etc. Should be unbiased thought but rarely is
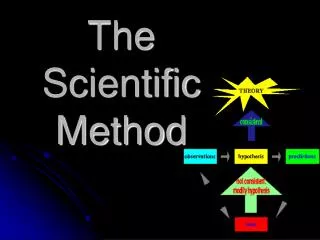
The Scientific Method Investigation of biological systems • Observation • Hypothesis • Predictions • Test • Analysis of results • Conclusion
Formulating a Hypothesis Proposes the answer to a question about an observation e.g. Exposure to fertilizer increases reproduction of bean plants
A Good Hypothesis … Must be testable and falsifiable A hypothesis can be falsified but can never be proven true: evidence can only support Scientific knowledge is ever expanding as new methodologies are applied to old questions, etc.
Examples of Good Hypotheses: • Cactus spines reduce herbivory • UVB radiation causes limb deformities in amphibians Examples of Untestable Hypotheses: • Women are more moral than men • Dogs are smarter than cats
Testing a Hypothesis Scientific experiment (either falsifies or supports a hypothesis) • Make predictions • Determine variables • Design an experimental procedure • Carry out procedure
Making Predictions Based on an experiment designed to test a hypothesis If/then statements: “If the hypothesis is true, then the results of the experiment will be …” e.g. If exposure to fertilizer increases reproduction of bean plants, then the number of pods per plant should increase in plants exposed to fertilizer compared with control plants.
If results match prediction, hypothesis is supported If not, the hypothesis is falsified Knowledge of process has been increased either way, regardless of findings
Determining Variables Factor, trait, or condition that can exist in different amounts or types
Independent variable The variable of interest Is deliberately manipulated (changed) Only one is usually chosen (need to know which factor is affecting the dependent variable)
Dependent variable Is measured or observed during an experiment Value is caused by and depends on the value of the independent variable
Control variable Is kept constant (so that will not affect outcome of experiment)
e.g.Exposure tofertilizerincreases reproductionof bean plants Independent: fertilizer Dependent: number of bean pods Control: Other things that would affect bean reproduction e.g. amount of water, temperature, amount of light, etc.
Examples The relationship between drug dosage & frequency / intensity of symptoms Independent: amount of drug administered (dosage) Dependent: Frequency / intensity of symptoms The relationship between plant growth rate & duration of light exposure Independent: Amount of time of exposure to light Dependent: Plant growth rate
Designing a Procedure Methodology for an experiment Quantitative (counts/measurements) methods usually better than qualitative (descriptive) (allows re-testing of hypothesis by same or others)
Control Treatment Independent variable either held at a standard value or omitted Results compared between control and experimental treatments Allows scientist to decide if predicted effect is due to independent variable or random chance
Examples Researchers want to test the effects of a drug for treating a medical condition. To ensure that the drug actually works, they would use a control group of people … … who take a placebo drug Researchers want to see the effects of drinking caffeinated water. The control group… … would drink plain water
Level of Treatment Values set for independent variable (based on prior knowledge/previous research) Can be: • One specific value (e.g. specific temperature) • Range of values (e.g. range of temperatures) Some experiments have no level of treatment • e.g. gender
Replication Procedure is repeated several times to see if results are consistent Gives an idea of how much variation is present Results from different trials are averaged
Sample Size Larger sample size = greater confidence Sampling Error Mean & standard deviations of sample differ from that of population from which taken Larger sample size = lower sampling error
Exposure to fertilizer increases reproduction of bean plants Level of treatment: • Specific amount of fertilizer OR • Range of amounts/concentration of fertilizer Control: • Beans grown without applying fertilizer Replication and sample size: • Depends … the more the better
Presenting & Analyzing Results Analysis: Simple to advanced statistics Presentation: Tables and/or figures • Show relationships between independent and dependent variables • Bar graphs vs. line graphs More on this in next week’s lab
Drawing Conclusions Results are interpreted: Was hypothesis supported or falsified? If supported: Additional experiments suggested to further support hypothesis (using same or different methods) If falsified: Alternative hypotheses for testing suggested
Exposure to fertilizer increases reproduction of bean plants If more pods found on plants treated with fertilizer: Hypothesis is supported Could try different amounts/concentrations of fertilizer, different fertilizers, etc. Could also see if combination of variables affects reproduction e.g. fertilizer & water, fertilizer & light
Exposure to fertilizer increases reproduction of bean plants If no significant difference in number of pods on beans in either treatment (control or experimental): Hypothesis is falsified Could try testing other factors e.g. temperature, amount of water, amount of light, etc.
From Hypothesis to Theory How does something become a scientific theory? When multiple rigorous tests have not disproved a certain hypothesis (i.e. an idea with “great explanatory power”) A theory can be used to interpret other data and observations
Limits of Science Only testable hypotheses are valid Some things are “unexplainable” or “untestable” Supernatural, morality, etc.