Download
1 / 17
170 likes | 178 Views
Types of Functions, Rates of Change. Lesson 1.4. Constant Functions. Consider the table of ordered pairs The dependent variable is the same It is constant The graph is a horizontal line. Linear Functions. Consider this set of ordered pairs

E N D
Types of Functions, Rates of Change Lesson 1.4
Constant Functions • Consider the table of ordered pairs • The dependent variable is the same • It is constant • The graph is a horizontal line
Linear Functions • Consider this set ofordered pairs • If we plot the pointsand join them wesee they lie in aline • • • •
6 3 Rate of Change • Given function y = 3x + 5 • • • •
Rate of Change • Try calculating for differentpairs of (x, y) points • You should discover that the rate of change is constant … in this case, 3
Family of Linear Functions • Slope = Rate of Change y=3x + 5 • Slope = m = 3 • y-intercept = b = 5
Slope and Y-Intercept • Considering y = m * x + b • The b is the y-intercept • Where on the y-axis, the line intersects • On your calculator • Go to Y= screen • Enter at Y1 (2/3) * x + 5 • Predict what the graph will look like before you specify F2, 6 for standard zoom
• Slope and Y-Intercept • The function y = (2/3) * x + 5 • Slope = 2/3 (up to the right) • Y-intercept = 5
Slope • When slope = • Try y = -7x – 3(predict the results before you graph)
Family of Linear Functions • Calculating slope with two ordered pairs (X2, Y2) • (X1, Y1) • Given two ordered pairs, (7,5) and (-3,12). What is the slope of the line through these two points?
You may need to specify the beginning x value and the increment Rate of Change • Consider the function • Enter into Y= screen of calculator • View tables on calculator (♦ Y)
Rate of Change • As before, determine therate of change fordifferent sets of orderedpairs
Rate of Change (NOT a constant) • You should find that the rate of change is changing – NOT a constant. • Contrast to thefirst functiony = 3x + 5
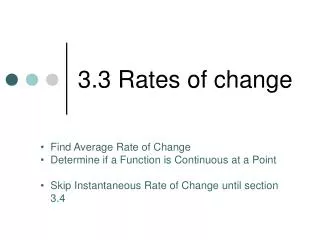
Function Defined by a Table • Consider the two functions defined by the table • The independent variable is the year. • Predict whether or not the rate of change is constant • Determine the average rate of change for various pairs of (year, sales) values
Warning • Not all functions which appear linear will actually be linear!! • Consider the set of ordered pairs • Graph them • Decide whether graphis linear • Check slope for differentpairs
Results • Graph appearsstraight • But …rate of change is not a constant
Assignment • Lesson 1.4 • Page 53 • Exercises 1 – 71 EOO