Download
1 / 46
520 likes | 1.15k Views
Risk, Return, and CAPM. Professor Thomson Fin 3013. Expected Returns. Decisions must be based on expected returns. Methods used to estimate expected return. 1. Historical approach. 2. Probabilistic approach. 3. Risk-based approach.

E N D
Risk, Return, and CAPM Professor Thomson Fin 3013
Expected Returns Decisions must be based on expected returns Methods used to estimate expected return 1. Historical approach 2. Probabilistic approach 3. Risk-based approach
Using 1900-2003 annual returns, the average risk premium for U.S. stocks relative to Treasury bills is 7.6%. Treasury bills currently offer a 2% yield to maturity Expected return on U.S. stocks: 7.6% + 2% = 9.6% 1. Historical Approach for Estimating Expected Returns Assume that distribution of expected returns will be similar to historical distribution of returns. Can historical approach be used to estimate the expected return of an individual stock?
Limitations of historical approach for individual stocks May reflect GM’s past more than its future Many stocks do not have a long history to forecast expected return Historical Approach for Estimating Expected Returns Assume General Motors long-run average return is 17.0%. Treasury bills average return over same period was 4.1% GM historical risk premium: 17.0% - 4.1% = 12.9% GM expected return = Current Tbill rate + GM historical risk premium = 2% + 12.9% = 14.9%
For example, assign probabilities for possible states of economy: boom, expansion, recession and project the returns of GM stock for the three states Outcome Probability GM Return Recession 20% -30% Expansion 70% 15% Boom 10% 55% 2. Probabilistic Approach for Estimating Expected Returns Identify all possible outcomes of returns and assign a probability to each possible outcome: GM Expected Return = 0.20(-30%) + 0.70(15%) +0.10(55%) = 10%
1. Measure the risk of the asset • Systematic risks simultaneously affect many different assets • Investors can diversify away the unsystematic risk • Market rewards only the systematic risk: only systematic risk should be related to the expected return 3. Risk-Based Approach for Estimating Expected Returns 1. Measure the risk of the asset 2. Use the risk measure to estimate the expected return as a function of the risk How can we capture the systematic risk component of a stock’s volatility?
Portfolios • Definition: A portfolio is a collection of assets (which could be a single asset if you so choose) • This is the ONE CHOICE an investor has • You don’t choose which stocks are available to invest in (you do not choose whether Microsoft stock exists) • You don’t choose the how risky a stock is • You don’t choose the rate of return the stock offers
Portfolio Choice • How you choose your portfolio, however, does have consequences • If you put all your money into Treasury Bills, you will have no risk, and a low expected return • If you put all of your money into MCI you will have a high risk and high expected return
Portfolio Weight • Your portfolio choice is measured by its portfolio weight. This is the $ proportion that you invest in each asset • Let wi = portfolio weight
Portfolio Weight Example You invest $100 in stocks, $80 in bonds, and $20 in Tbills. What are your portfolio weights? (Note the value of your portfolio is $200) Wstocks = 100/200 = 50% Wbonds = 80/200 = 40% WTBills = 20/200 = 10% Note: w1 + w2 + w3 + . . . + wN = 1 i.e. Portfolio weights must sum to 1.
Expected Return on a Portfolio • The expected return on a portfolio is weighted return of the individual securities. E(Rp) = w1E(R1)+w2E(R2)+w3E(R3) + . . .+ wNE(RN) For the previous example, suppose the expected return on stock is 10%, the expected return on bonds is 5%, and the expected return on Tbills is3%, the the expected portfolio return is: E(Rp) = 0.5*10% + 0.4*5% + 0.1*3% = 5% + 2% + 0.3% = 7.3%
Risk for a Portfolio Given that the expected return for a portfolio is E(Rp) = w1E(R1)+w2E(R2)+w3E(R3) + . . .+ wNE(RN) By analogy one may think the risk, as measured by variance could be computed as: Var(Rp) = w1Var(R1)+w2Var (R2)+w3Var (R3) + . . . + wNVar (RN) But this is WRONG!! Why? “Risk Canceling”
A Contrived Example • Asset YESPUR will pay $100 if the Spurs take the NBA championship next year, and zero otherwise • Asset NOSPUR pays $100 if the Spurs do not win the NBA championship and pays zero otherwise. • Both of the above assets are risky, as we do not know who will win the NBA this season
Example, Continued • Suppose you buy one share of YESPUR for $10, and one share of NOSPUR for $85. What will the return on your portfolio be? • Whether the Spurs win or lose, this investment will have a payoff of $100. The cost to buy this portfolio is $95.
Example - Summary This example shows a case where one can combine two risky assets to create a risk free asset. In other words, it shows that judicious choice of risky assets can reduce overall portfolio risk In most cases, one cannot eliminate all risk in a portfolio, but one can reduce risk through judicious choices of which securities to include in your portfolio
Two Source of Portfolio Risk • The overall state of the economy • When the economy is booming, most investments benefit (and vice versa) • This is the source of “systematic” or “non-diversifiable” or “market” risk • Firm Specific Risk • Examples are patents, consumer tastes, disasters, strikes • This is “unsytematic” or “diversifiable” or “non-market” risk
Measuring Systematic Risk • Most common measure is b (beta) • Beta measures the amount of systematic risk of an asset (or portfolio) relative to the average systematic risk • By definition, the systematic risk of the market = 1
b (beta) b > 1 indicates more systematic risk than average (Page 301 shows Pfizer b = 1.67 b = 1 indicates average systematic risk (IBM shows b = 1.00) b < 1 indicates lower than average risk (Sears b = 0.67)
Beta and Risk Premium • In words, stocks with low betas are less affected by changes in the economy than are firms with high betas • Therefore, beta determines the risk premium • Note: b = 0 for the risk free asset (I.e. there is no systematic risk)
Portfolio Beta • The beta of a portfolio is simply the weighted average of the betas of the individual securities bp = x1b1 + x2b2 + x3b3 + . . . + xNbN • Note this is similar in construction to the expected return on a portfolio E(Rp)=x1E(R1) + x2E(R2) + x3E(R3) + . . .+ xNE(RN)
Example 7.1. Determining Portfolio Weights • What are the portfolio weights for a portfolio that has 80 shares of Stock A that sell for $42 per share and 40 shares of Stock B that sell for $68 per share?
Example 7.2. Portfolio Expected Return • You own a portfolio that has $500 invested in Stock A and $1,600 invested in Stock B. If the expected returns on these stocks are 12 percent and 18 percent, respectively, what is the expected return on the portfolio?
Example 7.3. Portfolio Beta • You own a portfolio with $2500 invested in Stock X, $1500 invested in Stock Y, and $1000 in Stock Z. The Beta of these three stocks are 1.8, 1.4, and 0.6, respectively. What is the portfolio beta?
Example 7.4. Targeting the return of your portfolio • You have $20000 to invest in a portfolio of Stock A and Stock G. You would like to earn a 14% rate of return. How much money will you invest in each stock? What will the Beta of your portfolio be?
Example 7.5. Targeting the risk of your portfolio • You have $20000 to invest in a portfolio of Stock A and Stock G. You feel that a Beta=1.2 would suit your risk tolerance. How much money will you invest in each stock? What return can you expect on this portfolio?
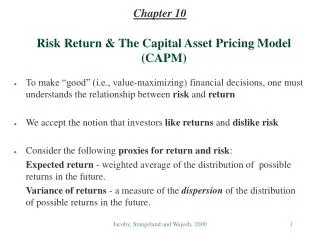
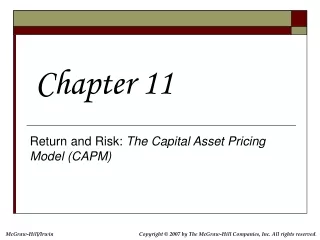
The statistical approach to estimate Beta • Collect data on a stock’s returns and returns on a market index • Plot the points on a scatter plot graph • Y–axis measures stock’s return • X-axis measures market’s return • Plot a line (using linear regression) throughthe points Slope of line equals beta, the sensitivity of a stock’s returns relative to changes in overall market returns Beta is a measure of systematic risk for a particular security.
Scatter Plot for Returns on Sharper Image and S&P 500 Sharper Image weekly returns S&P 500 weekly returns
Scatter Plot for Returns on ConAgra and S&P 500 ConAgra weekly returns S&P 500 weekly returns
Deriving the CAPMCapital Asset Pricing Model • See handwritten notes.
Definition: Market Portfolio • The market portfolio is the portfolio of all assets, with their weights proportional to their value as a percent of the value of the entire portfolio • E(Rm) = the expected return on the market portfolio • The Beta of the market portfolio = 1 • The equity risk premium (alternately called the market risk premium) is: = E(Rm) - Rf
E(Ri) = Rf + ßi[E(Rm) – Rf] • Return for bearing no market risk • Portfolio’s exposure to market risk • Reward for bearing market risk Security Market Line and CAPM The security market line is a graph of the CAPM The equation represents the risk and return relationship predicted by the Capital Asset Pricing Model (CAPM) for either individual stocks or portfolios of stocks
The Security Market Line Plots relationship between expected return and betas • In equilibrium, all assets lie on this line. • If individual stock or portfolio lies above the line: • Expected return is too high. • Investors bid up price until expected return falls. • If individual stock or portfolio lies below SML: • Expected return is too low. • Investors sell stock driving down price until expected return rises.
A - Undervalued • • A B • • B - Overvalued The Security Market Line E(RP) SML Slope = E(Rm) - RF = MarketRisk Premium RM • • RF • =1.0 i
Financial markets much larger, more competitive, more transparent, more homogeneous than product markets Much harder to create value through financial activities Efficient Markets Efficient market hypothesis (EMH): in an efficient market, prices rapidly incorporate all relevant information Changes in asset price respond only to new information. This implies that asset prices movements often seem random as news is random.
Why does this make sense? • If we could predict that the value of Google (now trading at about $400) is going to fall next year to $300. • What would you do in response to this information? • What would everyone else do in response to this information • What would the price of Google be tomorrow?
See Textbook Page 308 • Three investment strategies • Does this mean there is no investment strategy that will work? • Random data means you can always find a system that would have worked on the past data as there will always be some apparent correlation between some random data streams • Example: The super bowl predictor
Efficient Markets If asset prices unpredictable, then what is the use of CAPM? CAPM gives analyst a model to measure the systematic risk of any asset. On average, assets with high systematic risk should earn higher returns than assets with low systematic risk. CAPM offers a way to compare risk and return on investments alternatives.
So, how should you invest • If markets are efficient, all investment strategies should work equally well – that is - whatever your portfolio risk is, will ultimately determine your return • Hot stock tips are worthless • Fundamental Analysis (i.e. DDM’s are redundant • Know your risk tolerance and choose a well diversified portfolio that reflects your risk tolerance • Index funds are often a good choice to implement such a policy
Decisions should be made based on expected returns. Expected returns can be estimated using historical, probabilistic, or risk based approaches. Portfolio expected return (and portfolio beta) is computed as the weighted average of the expected returns (or beta) of theassets in the portfolio. CAPM predicts that the expected return on a stock depends on the stock’s beta, the risk-free rate (pure time value of money), and the risk of the stock which depends on the stock’s beta and the market risk premium. Risk, Return, and CAPM
2. Use the risk measure to estimate the expected return: • Plot beta against expected return for two assets: • A risk-free asset that pays 4% with certainty, with zero systematic risk and • An “average stock”, with beta equal to 1, with an expected return of 10%. • Draw a straight line connecting the two points. • Investors holding a stock with beta of 0.5 or 1.5, for example, can find the expected return on the line. Risk-Based Approach for Estimating Expected Returns Beta measures systematic risk and links the risk and expected return of an asset.
• ß = 1.5 Risk and Expected Returns Expected returns • 18% • 14% • • 10% “average” stock • 4% Risk-free asset • • • • • • • • • • 0.2 0.4 0.6 0.8 1 1.2 1.4 1.6 1.8 2 Beta What is the expected return for stock with beta = 1.5?
Expected return of a portfolio with N securities E(Rp) = w1E(R1)+ w2E(R2)+…+wnE(Rn) • w1, w2 , … , wn : portfolio weights • E(R1), E(R2), …, E(RN): expected returns of securities Portfolio Expected Returns How does the expected return of a portfolio relate to the expected returns of the securities in the portfolio? The portfolio expected return equals the weighted average of the portfolio assets’ expected returns
E(Rp) = w1E(R1)+ w2E(R2)+…+wnE(Rn) E(Rp) = (0.125)(10%) + (0.25)(12%) + (0.125)(8%) + (0.5)(14%) = 12.25% Portfolio Expected Returns
Portfolio Risk Portfolio risk is the weighted average of systematic risk (beta) of the portfolio constituent securities. ß P = (0.125)(1.00) + (0.25)(1.33) + (0.125)(0.67) + (0.50)(1.67) = 1.38 But portfolio volatility is not the same as the weighted average of all portfolio security volatilities
Portfolio composed of the following two assets: • An asset that pays a risk-free return Rf, , and • A market portfolio that contains some of every risky asset in the market. Security Market Line Security market line: the line connecting the risk-free asset and the market portfolio