Download
1 / 37
370 likes | 523 Views
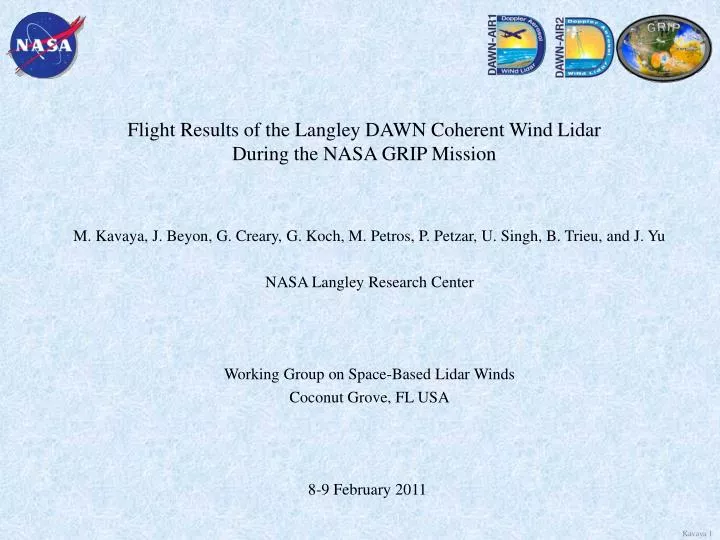
Flight Results of the Langley DAWN Coherent Wind Lidar During the NASA GRIP Mission. M. Kavaya, J. Beyon, G. Creary, G. Koch, M. Petros, P. Petzar, U. Singh, B. Trieu, and J. Yu NASA Langley Research Center Working Group on Space-Based Lidar Winds Coconut Grove, FL USA 8-9 February 2011 .

E N D
Flight Results of the Langley DAWN Coherent Wind Lidar During the NASA GRIP Mission M. Kavaya, J. Beyon, G. Creary, G. Koch, M. Petros, P. Petzar, U. Singh, B. Trieu, and J. Yu NASA Langley Research Center Working Group on Space-Based Lidar Winds Coconut Grove, FL USA 8-9 February 2011
Acknowledgements NASA SMD Ramesh Kakar GRIP AITT-07 “DAWN-AIR1” Jack Kaye $ Augmentation NASA SMD ESTO George Komar, Janice Buckner, Parminder Ghuman, Carl Wagenfuehrer LRRP, IIP-04 “DAWN” IIP-07 “DAWN-AIR2” Airplane Change & Rephasing NASA LaRC Director Office, Steve Jurczyk, $ Augmentation NASA LaRC Engineering Directorate, Jill Marlowe, John Costulis, $Augmentation NASA LaRC Chief Engineer, Clayton Turner, 1 FTE NASA LaRC Science Directorate Garnett Hutchinson, Stacey Lee, and Keith Murray
2-Micron Pulsed Wind Lidar System Development prior to 2007 2008 2010 5.9” x 11.6” x 26.5”; 75 lbs • 90-mJ energy, 5-Hz rep. rate • breadboard implementation • required frequent re-alignment • required highly skilled operators • required constant oversight • 250-mJ energy, 5-Hz rep. rate • rugged compact packaging of • laser and parts of receiver • no re-alignment needed, even • after transport to field sites • requires moderately skilled operator • unattended operation • installed in mobile trailer • 250-mJ energy, 10-Hz rep. rate • rugged compact packaging of • complete optical system • no re-alignment needed, even • in high vibration environment • installed in DC-8 aircraft
DAWN TXCVR Telescope Newport Scanner (RV240CC-F) DC8 Port/Window/Shutter 29” x 36” x <37” Tall Sealed Enclosure & Integrated Lidar Structure DAWN System Integration 3/8” Cooling Tube
DAWN depicted in DC-8 Mechanical Connections Scan Pattern During GRIP 0 deg Azimuth at Surface is 4.6 km fore of DC-8
DAWN Lidar Specifications Pulsed Laser Ho:Tm:LuLF, 2.05 microns 2.8 m folded resonator ~250 mJ pulse energy 10 Hz pulse rate 200 ns pulse duration Master Oscillator Power Amplifier One amplifier Laser Diode Array side pumped, 792 nm ~Transform limited pulse spectrum ~Diffraction limited pulse spatial quality Designed and built at LaRC 2 chillers Mobile and Airborne NASA DC-8 LaRC VALIDAR Trailer Lidar System in DC-8 Optics can in cargo level Centered nadir port 7 One electronics rack in cargo level Two electronics racks in passenger level Refractive optical wedge scanner, beam deflection 30.12 deg Conical field of regard centered on nadir All azimuth angles programmable Lidar System 15-cm diameter off-axis telescope 12-cm e-2 beam intensity diameter Dual balanced heterodyne detection InGaAs 75-micron diameter optical detectors Integrated INS/GPS One chiller
29” x 36” x <37” Tall DAWN Compared to Commercial Doppler Lidar Systems Coherent detection wind lidar figure of merit* The LaRC DAWN advantage in FOM may be used to simultaneously improve aerosol sensitivity, maximum range, range resolution, and measurement time (horizontal resolution). *SNR is not a good FOM
View From Outside DC-8 Optics canister window, but no DC-8 window yet
Two of Three Cabin Stations Laser Control & Data Processing
Lidar Operation in GRIP • DAWN had one single, 3-hr checkout flight • DAWN “worked” on its first flight in the sense of getting atmospheric return signal • The DC-8 departed for the GRIP science campaign 3 days later • During GRIP, the DC-8 flew 3 shakedown, 1 checkout, 6 ferry, and 15 science flights for 113 science hours and139 total hours. Shakedown flight days included pilot proficiency training with many takeoff/landings • Targets included 4 named storms: TD5, Earl, Gaston, Karl • Most flights were in or over thick clouds, and over water • Problems with DAWN were discovered and worked on with ad hoc priority • In the end, DAWN collected wind data for a majority of the flight hours • The alignment of DAWN lasers and optics was maintained through cross-country shipment, forklift ferrying, 139 flight hours, 3 hurricanes, amazingly strong bumps, and ~40 takeoff/landing pairs
Lidar Operation in GRIP • Right away, a decrease in laser pulse energy when at altitude was observed • The problem was the very cold temperature of the DC-8 bottom • Trial and error by clever laser operators discovered the laser running time could be extended by constant tweaking of the optical bench to lower temperatures • On different days, insulation was added between DAWN and the bottom, external heaters were added, the optics air stream for condensation was removed, and a heater/fan was added inside the optics canister • Each action improved the situation and we quickly could get laser operation for all of the long flights albeit with a lot of operator attention • The problems are being investigated now and some of the solutions will be “permanently” added • This will not be a problem in the future
Lidar Operation in GRIP • The laser pulse energy was calibrated after GRIP. It appears to have been in the range of 130-190 mJ instead of the planned 250 mJ, for a loss of 1.2-2.8 dB • Prior to GRIP, schedule slips and a broken laser rod on 6/24/10 led to a compressed schedule for integration, alignment and testing • We think the laser was not optimally aligned for GRIP • This may tie in to the thermal sensitivity of the laser • We believe we can restore the full 250 mJ for the future • The three laser diode array power supplies would fault several times during each flight • No fix was found during GRIP. Each time cost perhaps 15 minutes of data • Working with the vendor (DEI) has already fixed one unit. The other two will be fixed • The problem was an overly aggressive fault sensing procedure in the units
Lidar Operation in GRIP • Also from the very first flight, the data appeared to have much too low SNR • The calculated and displayed wind magnitude and direction were clearly incorrect • Without some facts that we would discover later, a multipronged approach was launched • Noise whitening was added to the processing • Changes in displays were made to permit better diagnostic views • The receiver electronics were checked and amplifier/attenuator changes were made • The wind calculation equations including rotation matrices were called in to question. Other algorithms and matrices were tried • We repeatedly asked the GRIP mission and DC-8 for low altitude flights over land, but this was largely unmet due to various reasons
Lidar Operation in GRIP • After GRIP, the telescope secondary mirror was found to have a burn area right where the beam reflects • This probably started with a piece of dust, burned by the laser • Unfortunately, the mirror faces up, so dust might settle on it • We are considering adding a swing in cover and/or an air puff system • The loss of SNR is estimated to be 10 dB • We think it was burned for all of GRIP • The telescope has been returned to Nu-Tek and found to have maintained alignment • The telescope secondary mirror is being replaced, and a spare mirror being made • The lower SNR (~13 dB) is making other investigations very difficult, such as rotation matrix and equation confirmations
Received Power vs. Altitude vs. Time – 9/1/10 • Taking off from Fort Lauderdale to fly into Earl • Note 15 min ending at 5:13 pm. • Very close to full profiles of wind from 10 km to surface • Probably because laser not yet cooled so bench T not yet lowered so receiver aligned
+f0 30.12° Lidar & Dropsonde Wind Magnitude, 9/1/10 GRIP DAWN (L) & Dropsonde (D) 9-1-2010 D Begin 17:19:27 Zulu DC-8 at 10,586.40 m L Pattern 118 V8-016 RIPIYI V8-016 RPY Very Preliminary V8-016 YIPIRI V8-016 YPR
DAWN During GRIP Campaign Nominal Scan Pattern To Scale, Measurement Altitude = 0 m • Must remember what is being compared When the subject dropsonde splashed, the DC-8 was 115.3 km away from the launch position Sept. 1, 2010Dropsonde launched at 17:20:15.49 Zulu Dropsonde hit water 17:33:36.5 Zulu 13 min, 21 sec total
DAWN During GRIP Campaign Nominal Scan Pattern To Scale, Measurement Altitude = 0 m 196 seconds = 3 min, 16 sec = 28,224 m
DAWN During GRIP Campaign Nominal Scan Pattern To Scale, Measurement Altitude = 0 m • Top View
DAWN During GRIP Campaign Nominal Scan Pattern To Scale, Measurement Altitude = 0 m • Very close up
Wind Measurement Volume Each shot accumulation rectangle consists of 2 sec and 20 laser shots Each scan pattern has 5 of these “20 string harps” tilted rectangles. Each “harp string” is approximately a cylinder of 20 cm diameter.
Plans • Investigation of the DAWN lidar hardware, algorithms, and software is continuing • Repairs and improvements are underway • Data processing is proceeding. We are slowly making progress in understanding coordinate transformations, rotation matrices, our INS/GPS unit, and key lidar behavior for data reduction. Dave Emmitt will help us. • Have requested modest funds to piggy back on DC-8 in FY11 to better show capability of technology
DAWN Shipment LaRC Palmdale CA
Ground-Based Lidar Compared with Wind Sonde • lidar wind measurements were validated against balloon sondes. • agreement (RMS difference) to 1.06-m/s speed and 5.78-degrees direction. • airborne lidar results are being compared to dropsondes (a complicated • analysis) and in-situ wind sensor at aircraft altitude.
Ground-Based Field Test nocturnal jet shear • field test showed: • unprecedented • capability for • high altitude • wind measurements. • agreement with • balloon sondes. • hybrid lidar demo • alongside GSFC • lidar.
Telescope & Scanner beam from transceiver coherent lidar uses the same path for transmit and receive— transmitted path is shown here. l/4 wave plate telescope scanner optical wedge scanner rotation stage window aircraft body
Pulsed Coherent Lidar Measurement of Wind Frequency Shifts of Light
1 Direction, 1 Laser Shot Nominal Data Capture Parameters Sample 1024 Sample 1025 Typical Range Gate 512 ADC samples 1.024 microseconds 153.49 m DLOS 132.93 m Dz DFT fMAX = 250 MHz fRES = 0.9766 MHz VRES = 1.0027 m/s 1024 samples for outgoing Df measurement Range gate 2 Range gate 0 Sample 54,999 Sample 55,000 (75,000 possible) t ~ 109 microsec R ~ 16,334 m Sample 0 Sample 1 Range gate 1 Range gate 3 t t = 0 Laser pulse begins Sample 512 Sample 513 ADC = 500 Msamples/sec, l = 2.0535 microns, zenith angle = 30 deg., round-trip range to time conversion = c/2 = 149.896 m/microsec
Periodogram: Estimating Signal FrequencyAfter NP Shot AccumulationOne Range Gate, One Realization Mean Data Level = LD Data Fluctuations = sD = LD /ÖNP Mean Signal Power = area under mean signal bump but above mean noise level. PS = AS = [(LD – LN) · Df · 1] (if signal in one bin) Mean Noise Level = LN Noise Fluctuations = sN= LN /ÖNP Mean Noise Power = area under mean noise level = PN = AN = LN·Df· (# Noise Bins) F = (LD - LN)/LN Data = Signal + Noise, D = S + N
Aircraft Location in Hurricane Earl (GOES 13 infrared) (green line is aircraft track for entire flight) DC-8 location