1 / 0

NASA-GRIP Field Experiment

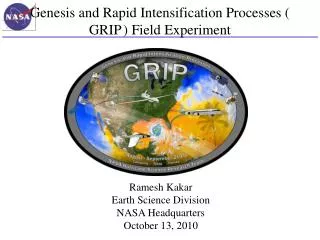
NASA-GRIP Field Experiment. Ramesh Kakar Weather Focus Area Leader TRMM, Aqua and GPM Program Scientist March 3,2010. NASA Hurricane Field Experiments. Field programs coordinated with other Federal Agencies. 1998. 2001. 2005. 2006. 2010 GRIP .

flann
Download Presentation

NASA-GRIP Field Experiment

An Image/Link below is provided (as is) to download presentation Download Policy: Content on the Website is provided to you AS IS for your information and personal use and may not be sold / licensed / shared on other websites without getting consent from its author. Content is provided to you AS IS for your information and personal use only. Download presentation by click this link. While downloading, if for some reason you are not able to download a presentation, the publisher may have deleted the file from their server. During download, if you can't get a presentation, the file might be deleted by the publisher.

E N D

Presentation Transcript


  1. NASA-GRIP Field Experiment

    Ramesh Kakar Weather Focus Area Leader TRMM, Aqua and GPM Program Scientist March 3,2010
  2. NASA Hurricane Field Experiments Field programs coordinated with other Federal Agencies 1998 2001 2005 2006 2010 GRIP NASA sponsored field campaigns have helped us develop a better understanding of many hurricane properties including inner core dynamics, rapid intensification and genesis
  3. Genesis: Distinguish the role of the larger-scale environment vs. meso-convective processes near the putative developing center. Rapid Intensification: Relative role of environmental vs. inner core processes? Is RI predictable? Test-bed: Evaluate candidate technologies for remote sensing from aircraft and from satellites. Wind lidar, high frequency passive microwave, dual-frequency radars, Global Hawk itself. Summary of GRIP Science Objectives(…any resemblance to those of IFEX and PREDICT is purely coincidental…)
  4. NASA Hurricane Research Science Team(selected competitively)

    ROSES 08 (Science Team) ROSES 09 (Field/Instrument Team) Scott Braun NASA GSFC Richard Blakeslee NASA MSFC Shu-Hua Chen U. of California, Davis Paul Bui NASA ARC William Cotton Colorado State U. Stephen Durden NASA JPL Robert Hart Florida State U. Michael Goodman NASA MSFC & Gerald Heymsfield NASA GSFC Svetla Hristova-Veleva NASA JPL Robert Houze U. of Washington Jeffrey Halverson UMBC/JCET Haiyan Jiang U. of Utah (to FIU) Andrew Heymsfield NCAR Tiruvalam Krishnamurti Florida State U. Gerald Heymsfield NASA GSFC Greg McFarquhar U. of Illinois Syed Ismail NASA LARC John Molinari U. of Albany Michael Kavaya NASA LARC Michael Montgomery Naval Postgrad School Tiruvalam Krishnamurti Florida State U. Elizabeth Ritchie U. of Arizona Bjorn Lambrigtsen NASA JPL Robert Rogers NOAA/AOML Nick Shay U of Miami Eric Smith NASA GSFC Christopher Thorncroft U. of Albany Edward Zipser U. of Utah
  5. GRIP: (Hurricane) Genesis and Rapid Intensification Processes Field Experiment Global Hawk (UAV) (240 hours) Radar (Heymsfield/GSFC), Microwave Radiometers (Lambrigtsen/JPL), Dropsondes (NOAA), Electric Field (Blakeslee/MSFC) Geosynchronous Orbit Simulation DC-8 four engine jet (120 hours) Dual frequency precipitation radar (Durden/JPL) Dropsondes (Halverson/UMBC), Variety of microphysics probes (Heymsfield/NCAR) Lidars for 3-D Winds (Kavaya/LaRC) and for high vertical resolution measurements of aerosols and water vapor (Ismail/LaRC) In-situ measurements of temperature, moisture and aerosols (Bui/ARC) Six to Eight week deployment centered on September 1, 2010 RED= IIP, GREEN= IIP+AITT Blue line: DC-8 range for 12-h flight, 6 h on station Red lines: GH range for 30-h flight with 10, 15 and 20 h on station Light blue X: Genesis locations for 1940-2006
  6. NASA Global Hawk 10/23/09
  7. GRIP GH Payload Driftsondes High Altitude Lightweight Dropsonde (Vertical profiles of temp, humidity, pressure & winds) HIWRAP High Altitude Imaging Wind and Rain Profiler (Horizontal wind vectors and ocean surface winds) HAMSR High Altitude MMIC Sounding Radiometer (Temp, H2Ov, Cloud liquid & ice distribution) LIP Lightning Instrument Package (Lightning and Electrical Storm observation)
  8. GRIP DC-8 Payload MMS Meteorological Measurement System (Insitu Press, Temp, 3D Winds and Turbulence) DAWN Doppler Aerosol Wind Lidar (Vertical Profiles of Vectored Horizontal Winds) Dropsondes (Vertical Profiles of Temp, Press, Humidity and Winds) CAPS, CVI, PIP (Cloud Particle Size distributions, Precip Rate, Rain & Ice water content) APR-2 Airborne Precipitation Radar Dual Frequency (Vertical Structure Rain Reflectivity and Cross Winds) LASE Lidar Atmospheric Sensing Experiment (H2Ov, Aerosol profiles and Cloud distributions)
  9. JPL High Altitude MMIC Sounding Radiometer (HAMSR) Microwave radiometer for 3-D all-weather temperature and water vapor sounding, similar to AMSU on NOAA platform 25 sounding channels in three bands: 50-60 GHz, 118 GHz, 183 GHz Cross track scanning + 45o off nadir 40 km swath at 20 km 2 km resolution Flew in CAMEX-4, TCSP and NAMMA JPL High Altitude MMIC Sounding Radiometer (HAMSR) Upgraded for Global Hawk operations under NASA AITT New state of the art receiver technology (developed under ESTO/ACT) Upgraded data system for real time communication Compact instrument packaging Noise reduced from 2 K to 0.2 K
  10. HAMSR Measurements T(z): Cross-track Flight path q(z): Cross-track T(z): Along-track q(z): Along-track HAMSR derived warm-core in Hurricane Erin CLW(z): Along-track Precipitation Structure/Imagery
  11. High-Altitude Imaging Wind and Rain Airborne Profiler (HIWRAP) MEASUREMENTS GOALS: Map the 3-dimensional winds and precipitation within hurricanes and other severe weather events. Map ocean surface winds in clear to light rain regions using scatterometry. NASA Global Hawk: 19 km altitude, 30 hours HIWRAP Characteristics: Conically scanning. Simultaneous Ku/Ka-band & two beams @30 and 40 deg Winds using precipitation & clouds as tracers. Ocean vector wind scatter-ometry similar to QuikScat.
  12. HIWRAP Global Hawk Configuration One of first weather radars utilizing low power solid state transmitters with pulse compression Digital Receiver IF/LO Subsystem Scanner in preparation for WB-57 test flights. Reflector HIWRAP scanner Ka-band Transceiver Ku-band Transceiver HIWRAP in “deep” radome
  13. GRIP Coherent Pulsed Doppler Wind Profiling Lidar System 3. Ground-based Wind Measurement Performance 2. Complete System Utilizing Transceiver 1. World’s Most Capable Transceiver Packaged, Compact, Robust RMS wind difference from balloon sonde, 0 – 6 km altitude, = 1.1 m/s and 5.8° No alignment needed after interstate travel in trailer Overnight unattended operation Vertical winds to 11 km altitude Horizontal vector winds to 7 km altitude Data processing choice of multiple values of vertical and horizontal resolution Same technology as anticipated space mission 0.25 J pulse energy, 10 Hz pulse repetition frequency (PRF) 15 cm receiver optical diameter, 34 kg (75 lbs.) 15.2 x 29.5 x 67.3 cm (6 x 11.6 x 26.5 inches) 4. Enclosure for All Lidar Optics Robust Aircraft Design 6. Lidar System in DC-8 5. Optics in DC-8
  14. VALIDAR and Wind Sonde Comparison: Wind Profile and direction and RMS Difference Ground-Based Hybrid Wind Lidar Demo All data shown above were taken on February 24, 2009, sonde was launched at 17:59 local (Feb. 25, 2009 00:59 UTC) Wind sondes are balloons carrying aloft a GPS receiver—the receiver radios back the balloon’s position to determine the horizontal wind vector VALIDAR using 3-minute integration time. Jumps off the scale above 5.5-km are due to “bad” points where wind is not being measured from low SNR (Fig 1 a & c) Root-mean-square of difference between two sensors for all points shown = 1.06 m/s ( Fig 1b) Root-mean-square of difference between two sensors for all points shown = 5.78 deg (Fig 1d) LaRC 2-mm Doppler lidar “VALIDAR/DAWN” GSFC 355-nm Doppler lidar “GLOW” Fig 1 (a) Fig 1 (b) Fig 1 (d) Fig 1 (c)
  15. GRIP Coherent Pulsed Doppler Wind Profiling Lidar System Nominal Parameters Laser beam nadir angle = 45 degrees (unchangeable) Laser beam azimuth angle = 45, 135, 225, and 315 degrees 60 laser shots per LOS wind profile (12 sec) LOS wind profiles 8.8 km from track Aft LOS profile begins 71 s after Fore began Fore and Aft LOS wind profile = 1 horizontal wind profile (83 s measurement time) Left and Right of track horizontal wind profiles = 1 scan pattern Pattern repeat = horizontal resolution = 12.5 km (50 sec) Vertical profile of horizontal wind magnitude and direction “= balloonsonde launch or very tall anemometer tower” DC-8:   425 – 490 knots True Air Speed (cruise) = 218 - 252 m/s (250). 41,000 ft = 12.5 km
  16. LASE Measurements of Water Vapor and Aerosol Profiles and Cloud distributions During the GRIP Field Experiment Syed Ismail, Rich Ferrare, John Hair (NASA Langley) In collaboration with Ed Browell (LaRC) and Jason Dunion (NOAA) Water vapor profiles - daytime and nighttime - surface to upper trop. - 0.01 to 25 g/kg - accuracy: 6% or 0.01 g/kg - resolution (variable) vertical: 330 m horizontal: 14 km (1 min) Aerosol/cloud profiles - daytime and nighttime - 0.03 to 25 km resolution (variable) vertical: 30 m horizontal: 200 m Airborne Water Vapor DIAL Laser - 5 Hz doubled-pulsed Ti:sapphire - 100 mj at lon and loff Wavelengths - 815 nm (lon- loff = 40-70 pm) - Two separate line pairs NASA DC-8 aircraft Simultaneous nadir, zenith operations Real-time data analysis and display
  17. Summary NASA sponsored field campaigns have helped us develop a better understanding of many hurricane properties including inner core dynamics, rapid intensification and genesis GRIP is a very exciting field experiment and took over three years to plan Hopefully we will have enough “Genesis” and “Rapid Intensification” cases to study during the coming hurricane season 18
More Related