Download
1 / 20
210 likes | 300 Views
Hi all! I’m sorry I can’t be there with you…. The Spectrum of Solar Wind Charge Exchange Emission: Contribution to the SXRB. D. Koutroumpa, R. Lallement & V. Kharchenko, A. Dalgarno Local Bubble & Beyond II April 21-24, 2008 Philadelphia, USA. Outline.

E N D
Hi all! I’m sorry I can’t be there with you… The Spectrum of Solar Wind Charge Exchange Emission:Contribution to the SXRB D. Koutroumpa, R. Lallement & V. Kharchenko, A. Dalgarno Local Bubble & Beyond II April 21-24, 2008 Philadelphia, USA
Outline • General characteristics of heliospheric SWCX emission • Model description: • Stationnary • Dynamic • Model-Data comparison (using shadowing observations) • ¾ keV band (Chandra, XMM, Suzaku) • ¼ keV band (ROSAT, Wisconsin surveys)
Extragalactic : unresolved sources Warm-Hot Intergalactic Medium (as Power Law emission) Absorbed by IS gas, distant Galactic Halo: ~15kpc -Close-by Supernovae remnants (e.g. Loop I): ~150-200 pc -Local Bubble: ~100 pc (Hot Gas Thermal emission) Heliosphere: 200 AU (UW) – 40000AU (DW) Local, unabsorbed (SWCX) Contributions to the Soft X-ray Background NOT IN SCALE ? Geocorona: RE
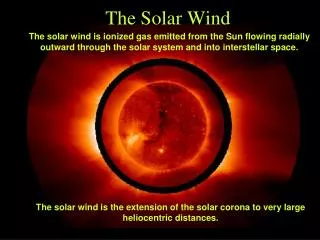
Interstellar Neutrals H, He all around the Heliosphere Charge transfer Source term Loss term Where does the heliospheric emission end? IS medium heliopause termination shock DW UW Along a given line-of-sight the contribution to the emission ends: - either at the heliopause - in the downwind direction where the particular solar ion has been entirely consumed O8+ + [H, He] → O7+ + [H+, He+] O7+ + [H, He]→ O6+ + [H+, He+] etc.
Total intensity along a L-O-S CX emissivity εhν along a Line-Of-Sight 88% of total emission due to H in D<10 AU 98% of total emission due to He in D<5 AU For an observer on Earth the inner Heliosphere contributes the most to the SXRB, with respect to the Heliosheath
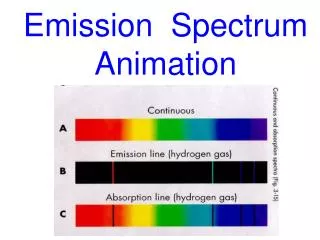
Main lines in ¾ keV band ¼ keV band Spectra of SWCX emission 0.1-1 keV
0.55 1.0 1.5 0.6 0.90 1.05 MIN MAX MIN MAX 0.1 1.0 2.1 0.5 2.0 3.5 Computed X-ray maps: OVIII 0.65 keV Observer at λ = 74° Observer at λ = 252° Colorscales in units of 10-9 erg cm-2 s-1 sr-1 RED: low BLUE: high Koutroumpa et al., A&A 2006
He cone 90° Suzaku 2006 120° 60° 150° 30° 180° 0° 210° 330° Chandra 2000 300° 240° 270° Parallax effects in SWCX emission Predicted by Lallement, 2004 (calculated for the MBM 12 line of sight)
Time delay between Sun and Earth April/May 1998 Temporal variability of the ¼ keV background: CX signature Emission time at solar surface First simplified model: Cravens et al, 2001, J. Geophys. Res Days from Jan 1st, 1996 GEOCORONA X-ray contribution to the ROSAT 0.25 keV background: About 1/10 of the average measured background
Modeling the SW variations Spiral’s width equivalent to time duration, SW enhancements modeled as step functions ACE, Wind database search for: -SW proton flux & -Heavy ion abundance variations
-3.0d : -2.5d -2.3d : -1.8d -1.5d : -1.0d -0.5d : 0.0d Solar Wind enhancement localization for t1=-3 d to t2 = 0 d Δt γ (λ=0°) S LOS (λ=148°) 2 AU 1 AU E (λ=251°)
Smooth heliospheric lightcurves can be tricky: ex. MBM 12 (Feb. 2006, Suzaku) -Global solar activity: Min, higher SWCX X-rays than Max ON-CLOUD: Model intensities: Data (Smith et al., 2007): I (O 6+) = 3.56 LU I (O 6+) = (3.34±0.26) LU I (O 7+) = 0.5 LU I (O 7+) = (0.24±0.10) LU -LOS crossing the He cone: OFF-cloud exposure sees denser IP region OFF-CLOUD: Model intensities: I (O 6+) = 4.62 LU I (O 7+) = 0.77 LU -Local SW conditions: Intense spike at end of ON-cloud exp. Koutroumpa et al., 2007
Using Shadowing observations Targets: Dense molecular clouds OFF-CLOUD: Foreground (geocorona, heliosphere, LB) + Distant (galactic halo, extragalactic) ON-CLOUD (ideal case): All distant components are absorbed
SWCX Model to Unabsorbed (Local) Data Fit in ¾ keV band SWCX model applied to 2 shadowing fields: -MBM 12 (Chandra 2000, Suzaku 2006) -South Galactic Filament - SGF (XMM 2002, Suzaku 2006) -Taking into account real observation geometry -Real-time SW conditions: max in 2000-2002 and min in 2006 Old analysis →Koutroumpa et al., 2007 New analysis →updates from Henley et al., 2008 Unabsorbed emission attributed to the Local Bubble in the ¾ keV band consistant with zero: OVII: LB Io = (0.09 ± 0.73) LU OVIII: LB Io = (0.46 ±0.44) LU
Snowden et al., 2000 Using shadowing in the ¼ keV band soft X-ray background that does NOT anticorrelate with the IS column density Soft X-ray shadows study:ROSAT R1+R2 (R12) data correlated with IRAS (100μm) data (scaled to H Icolumn density) Ix = Io + I1×exp [σ(NH, T6.0) ×NH] + A Ix : observed intensity Io : Foreground emission I1 : Halo emission A: fixed emission for absorbed hot Halo & ExtraGalactic Io : attributed to the Local Bubble X-ray intensity (10-6 counts s-1 arcmin-2) vs H I column density NH(10 20 cm-2)
HOT HALO SUN GALACTIC DISK LOCAL BUBBLE HOT GAS HOT HALO Picture 1 Io:SOFT X-RAY FROM THE LOCAL BUBBLE INCLUDING SOLAR REGION Higher Io → LB more extended
heliopause termination shock E (CW) UW DW Model-Data comparison: ¼ keV -Spectra calculated in ROSAT observation geometry -Convolved with ROSAT R1, R2 & Wisconsin B, C band responses
SUN SOLAR WIND CHARGE TRANSFER Picture 2 What if… R12 EMISSION FROM LOW LATITUDES == SOLAR X-RAY AT HIGH LATITUDES FROM HALO??
C band SWCX B band SWCX Comparison to Wisconsin B band Snowden et al., 1990 -Still good agreement in low G latitudes for C band (similar to R12) -SWCX emission not enough to account for the emission observed in the B band There is more than SWCX in the local SXRB BUT WHAT ? -Can not be at too high temperature (T < 106 K) → SWCX must be included -Can not be too low → OVI observational constraints
Conclusions • ¾ keV: shadows (almost) all the LOCALcomponent is SWCX from the Heliosphere • ¼ keV: • Band ratios (R2/R1 & B/C) for the data were interpreted only in terms of hot gas plasma emission from the LB (Heliospheric SWCX was unknown & thus neglected) • Heliospheric SWCX simulations give sufficient emission in the R12 (or C) band could account for SXRB in theGALACTIC DISK • SWCX model lower in the B band with respect to data • Including the heliospheric SWCX component to the data interpretation still leaves place for a ‘WARM’ Local Bubble T<106 K • Data analysis in both (¾ & ¼ keV) bands should be revised to include SWCX