Download
1 / 1
10 likes | 84 Views
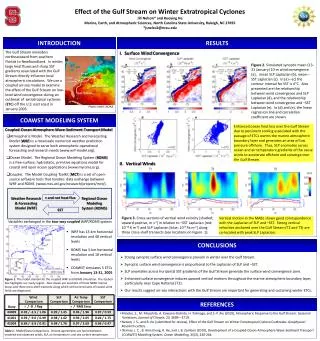
COMBINED EFFECT OF INCREASED CO 2 ON WINTER WHEAT YIELD Present conditions = (the bottom red bar) direct effect = present weather, ambient CO 2 is increased non-direct effect = changed weather, ambient CO 2 is not increased

E N D
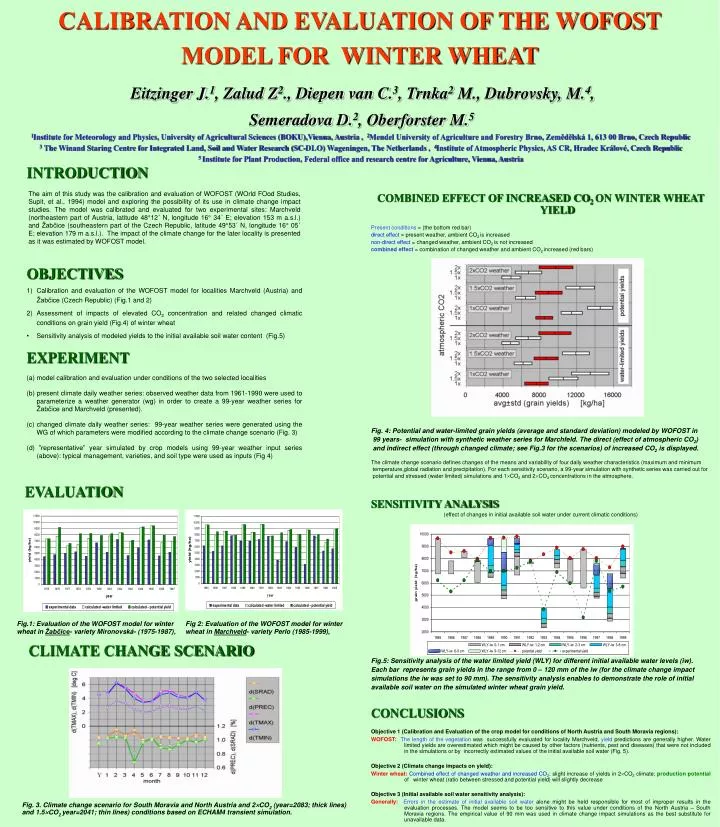
COMBINED EFFECT OF INCREASED CO2 ON WINTER WHEAT YIELD Present conditions = (the bottom red bar) direct effect = present weather, ambient CO2 is increased non-direct effect = changed weather, ambient CO2 is not increased combined effect = combination of changed weather and ambient CO2 increased (red bars) Fig. 4: Potential and water‑limited grain yields (average and standard deviation) modeled by WOFOST in 99 years- simulation withsynthetic weather series for Marchfeld. The direct (effect of atmospheric CO2) and indirect effect (through changed climate; see Fig.3 for the scenarios) of increased CO2 is displayed. The climatechange scenario defines changes of the means and variability of four daily weather characteristics (maximum and minimum temperature,global radiation andprecipitation). For each sensitivity scenario, a 99-year simulation with synthetic series was carried out for potential andstressed (water limited) simulations and 1CO2 and 2CO2 concentrations in the atmosphere. SENSITIVITY ANALYSIS (effect of changes in initial available soil water under current climatic conditions) Fig.5: Sensitivity analysis of the water limited yield (WLY) for different initial available water levels (iw). Each bar represents grain yields in the range from 0 – 120 mm of the iw (for the climate change impact simulations the iw was set to 90 mm). The sensitivity analysis enables to demonstrate the role of initial available soil water on the simulated winter wheat grain yield. CONCLUSIONS Objective 1 (Calibration and Evaluation of the crop model for conditions of North Austria and South Moravia regions): WOFOST: The length of the vegetation was successfully evaluated for locality Marchveld, yield predictions are generally higher. Water limited yields are overestimated which might be caused by other factors (nutrients, pest and diseases) that were not included in the simulations or by incorrectly estimated values of the initial available soil water (Fig. 5). Objective 2 (Climate change impacts on yield): Winter wheat:Combined effect of changed weather and increased CO2: slight increase of yields in 2CO2 climate; production potential of winter wheat (ratio between stressed and potential yield) will slightly decrease Objective 3 (Initial available soil water sensitivity analysis): Generally: Errors in the estimate of initial available soil water alone might be held responsible for most of improper results in the evaluation processes. The model seems to be too sensitive to this value under conditions of the North Austria – South Moravia regions. The empirical value of 90 mm was used in climate change impact simulations as the best substitute for unavailable data. CALIBRATION AND EVALUATION OF THE WOFOST MODEL FOR WINTER WHEATEitzinger J.1, Zalud Z2., Diepen van C.3, Trnka2 M., Dubrovsky, M.4, Semeradova D.2, Oberforster M.51Institute for Meteorology and Physics, University of Agricultural Sciences (BOKU),Vienna, Austria , 2Mendel University of Agriculture and Forestry Brno, Zemědělská 1, 613 00 Brno, Czech Republic3 The Winand Staring Centre for Integrated Land, Soil and Water Research (SC-DLO)Wageningen, The Netherlands , 4Institute of Atmospheric Physics, AS CR, Hradec Králové, Czech Republic5 Institute for Plant Production, Federal office and research centre for Agriculture, Vienna, Austria INTRODUCTION The aim of this study was the calibration and evaluation of WOFOST (WOrld FOod Studies, Supit, et al., 1994) model and exploring the possibility of its use in climate change impact studies. The model was calibrated and evaluated for two experimental sites: Marchveld (northeastern part of Austria, latitude 48°12´ N, longitude 16° 34´ E; elevation 153 m a.s.l.) and Žabčice (southeastern part of the Czech Republic, latitude 49°53´ N, longitude 16° 05´ E; elevation 179 m a.s.l.). The impact of the climate change for the later locality is presented as it was estimated by WOFOST model. • OBJECTIVES • Calibration and evaluation of the WOFOST model for localities Marchveld (Austria) and Žabčice (Czech Republic) (Fig.1 and 2) • Assessment of impacts of elevated CO2 concentration and related changed climatic conditions on grain yield (Fig.4) of winter wheat • Sensitivity analysis of modeled yields to the initial available soil water content (Fig.5) • EXPERIMENT • (a) model calibration and evaluation under conditions of the two selected localities • (b) present climate daily weather series: observed weather data from 1961-1990 were used to parameterize a weather generator (wg) in order to create a 99-year weather series for Žabčice and Marchveld (presented). • (c) changed climate daily weather series: 99-year weather series were generated using the WG of which parameters were modified according to the climate change scenario (Fig. 3) • (d) ”representative” year simulated by crop models using 99-year weather input series (above): typical management, varieties, and soil type were used as inputs (Fig 4) EVALUATION Fig.1: Evaluation of the WOFOST model for winter wheat in Žabčice- variety Mironovská- (1975-1987), Fig 2: Evaluation of the WOFOST model for winter wheat in Marchveld- variety Perlo (1985-1999), CLIMATE CHANGE SCENARIO Fig. 3. Climate change scenariofor South Moravia and North Austria and 2CO2 (year=2083; thick lines) and 1.5CO2year=2041; thin lines) conditions based on ECHAM4 transient simulation.