Download
1 / 41
410 likes | 525 Views
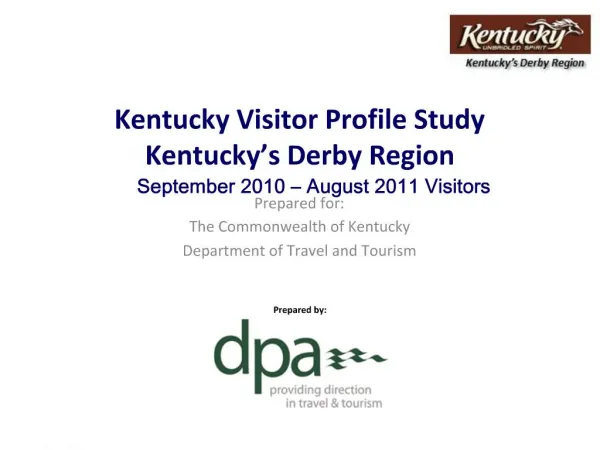
Kentucky Visitor Profile Study Bluegrass, Blues & BBQ September 2010 – August 2011 Visitors. Prepared for: The Commonwealth of Kentucky Department of Travel and Tourism. Prepared by:. Table of Contents. Background………………..……………………………………………………………………….. 3

E N D
Kentucky Visitor Profile StudyBluegrass, Blues & BBQSeptember 2010 – August 2011 Visitors Prepared for: The Commonwealth of Kentucky Department of Travel and Tourism Prepared by:
Table of Contents • Background………………..……………………………………………………………………….. 3 • Trip Planning…………………………………………………………………………………..…… 5 • Trip Characteristics………………………………………………………………………..……. 6 • Trip Assessment……………………………………………………………………………..…… 7 • Visitor/Travel Party Demographics………………………………………………..……. 8 • Appendix Methodology………………………………………………………………………………… 10 Regional Comparison Tables.………………………………………………………… 15
Background • The Kentucky Department of Travel and Tourism has commissioned DPA to conduct a research study profiling visitors within Kentucky during the period of September 2010 through August 2011. • The findings from this research will be used primarily to inform the development of future advertising and marketing plans for Kentucky’s tourism industry. To fulfill this responsibility, the Kentucky Department of Travel and Tourism (KDTT) requires accurate and timely information on tourism activity in the Kentucky. • This summary report focuses solely on the Bluegrass, Blues & BBQ region, with comparisons to the State in general.
Like visitors to Kentucky in general, visitors to the Bluegrass, Blues & BBQ Region are generally coming to the area for vacation or short pleasure trip (52%), although this proportion is just below the Statewide average of 61%. Visitors to the Region are more likely than visitors to Kentucky in general to say they are visiting for a festival or event (29% vs. 13%). An additional 24% come to visit family and friends. • Visitors to the Bluegrass, Blues & BBQ Region plan their trips in a slightly different manner than do visitors to the rest of the State. • Visitors to this region are more likely than Statewide visitors to use the Internet as a planning resource (64% vs. 58%). An additional 30% use friends and family or co-workers for trip advice. • Specifically, visitors use www.kentuckytourism.com (27%) and search engines (32%) to help plan their trips. • Like visitors to Kentucky in general, about two-thirds (64%) of visitors recall promotions for Kentucky. • The plurality (45%) of visitors to Bluegrass, Blues & BBQ report making accommodations reservations prior to leaving home. One in seven (15%) say they stayed with family or friends, while 14% say they did not stay overnight. • The majority of visitors to Bluegrass, Blues & BBQ say their decision to go to Kentucky was influenced by the peaceful/relaxing atmosphere (66%), the fact that it is a safe destination (63%) and that it was a clean, unspoiled environment (60%). Visitors to the Bluegrass, Blues and BBQ region are slightly less likely than Statewide visitors to mention it is a convenient location (57% vs. 64%). Trip Planning
Three-quarters (74%) of Bluegrass, Blues & BBQ visitors say they stayed in paid accommodations, equivalent to the 76% doing so statewide. • Visitors to Bluegrass, Blues & BBQ stayed an average of 3.9 nights in Kentucky. • During their stay, more than half (54%) reported going shopping, equal to the 54% statewide average. • Bluegrass, Blues & BBQ Region visitors are far more likely than Statewide visitors to say they attended events (57% vs. 37%). These events focused on fairs or festivals (25%), bluegrass concerts (21%) and amateur sporting events (11%). • The vast majority (83%) of visitors to the Region drove a personal vehicle, equal to the 84% State average. Trip Characteristics
Nearly all (90%) visitors to the Bluegrass, Blues & BBQ Region say they were satisfied with their visit. However, the proportion saying they were very satisfied with their visit is slightly below the Statewide average (58% vs. 63%). • These visitors also are likely to return to Kentucky, with 69% saying they definitely will return and 23% saying they probably will return. • Additionally, 95% are likely to recommend Kentucky as a vacation destination, similar to the 96% Statewide average. • Two in five (40%) visitors to Bluegrass, Blues & BBQ say it is about as expensive as they thought it would be, but 44% say it was less expensive than they expected, which is equivalent to the statewide average (41%). • Two in five (40%) visitors also feel the quality of accommodations exceeded their expectations. Again, this proportion is equal to the Statewide average. • Visitors to the region liked the scenery (52%) and friendliness of the people (40%) the most. These proportions are slightly below the Statewide averages of 63% and 49% respectively. • Twenty percent said they liked the quality of dining options, which is equivalent to the State average of 22%. • Not having enough time to do all they wanted to do was the most commonly mentioned “least favorite” feature. Trip Assessment
The typical visitor to the Bluegrass, Blues & BBQ Region is no more or less affluent than the average visitor to the State ($74,340 HHI vs. $74, 470 HHI). • These visitors are also slightly older than visitors to Kentucky in general (52.6 years old vs. 51.3). • Bluegrass, Blues & BBQ visitors are as likely as visitors to the State in general to bring children on their trip, with 26% of visitors to the Region traveling with children, compared to an equivalent 28% doing so statewide. • Like the rest of the State, the Region primarily draws its visitors from the South (50%) and Midwest (33%). Other DMA’s providing visitors to the Region include Evansville (18%) and Louisville (7%). • It appears that the Region is attracting more international visitors than the State in general, with 11% of the Region’s visitors coming from outside the US compared to just 6% of Statewide visitors coming from an international base. Visitor and Travel Party Profile
Methodology • Given the composition of past and current travelers needed to provide an annual profile of visitors, DPA employed a two-pronged data collection approach.
Past Visitors Methodology • Kentucky travelers during September 2010 through May 2011. • DPA conducted an online survey among KDTT’s database of e-newsletter subscribers. • Potential respondents were sent an email with an invitation to participate in an online survey about travel in Kentucky. • Qualified respondents had to have traveled in Kentucky during the specified time period, traveling more than 50 miles from home or staying overnight on their trip. • In total 924 qualified respondents participated in the survey from June 16, 2011 – July 24, 2011. Current Visitors • Kentucky travelers during June 2011 through August 2011. • DPA conducted a onsite intercept survey among Kentucky visitors at pre-determined locations, such as outdoor recreation areas, attractions, tourist shopping areas, festivals/events, etc. • Potential respondents were approached by trained interviewers and asked to participate in a survey of visitors to the area. • Qualified respondents had to be traveling more than 50 miles from home or staying overnight on their trip. The questionnaire was to be completed by the respondent and returned to the interviewer. • In total 895 qualified respondents participated in the survey from June 24, 2011 through August 27, 2011.
Methodology • The data collected provides a readable sample of visitors in each season. Respondents were grouped by season according to the month of their most recent trip. The total number of completed interviews by season is shown below. • Throughout report * denotes sample size less than 100. Please interpret with caution. • Throughout report a, b, c, etc. is significant at the 95 percent confidence level
Methodology • Additionally, the data collected provides a readable sample of visitors in each of Kentucky’s nine tourism regions. Respondents who visited multiple regions on their most recent trip were counted as a visitor in each of those regions so the groups are not mutually exclusive. The map below shows how each region is defined.
Trip Planning Discussion vs. Decision Timeline Q3. When did you “start talking” about going on this trip? Q4. When did you choose Kentucky for this trip?
Trip Planning Q5. When did you make accommodations reservations for your stay in Kentucky?
Trip Planning Q7. When you were planning this trip in Kentucky, which of the following sources did you use? (Please check ALL that apply.)
Trip Planning Q8. While planning this trip, which of the following web sites did you visit? (Please check ALL that apply.
Trip Planning * Percentages shown reflect top 2 box scores (rating of 4 or 5) Q10. When you were talking about visiting Kentucky, if one (1) is “Not at all influential” and five (5) is “Definitely Influential,” how strongly did the following influence your selection?
Trip Planning Q9. Over the past year, have you seen, read or heard any advertising, promotions or travel stories for Kentucky?
Trip Characteristics Q11. Earlier you said the [region selected ] region was your primary destination on your most recent trip to Kentucky. IN what other regions of Kentucky did you visit during your most recent trip? (Please check all that apply).
Trip Characteristics Q1. How did you travel to our area? Did you…(Indicate PRIMARY MODE of transportation ONLY.) Please check one.
Trip Characteristics Q12. What was your reason or reasons for visiting this area? (Please check ALL that apply.)
Trip Characteristics Q6a/Q6b. On this trip, how many days will you be: Away from home, In Kentucky? Q14. How many nights in total do you intend to stay in Kentucky?
Trip Characteristics Q18. Including yourself, how many people are in your immediate travel party? Q19. How many of those people are: Younger than 6 years old/6-11 years old/12-17 years old/Adults
Trip Characteristics Q15. Are you staying overnight…
Trip Characteristics Q13. Which of the following activities did members of your travel party participate in? (Please check ALL that apply.)
Trip Characteristics Q13. Which of the following activities did members of your travel party participate in? (Please check ALL that apply.)
Trip Characteristics Q13. Which of the following activities did members of your travel party participate in? (Please check ALL that apply.)
Trip Characteristics Q13. Which of the following activities did members of your travel party participate in? (Please check ALL that apply.)
Trip Assessment Q24. How satisfied are you with your stay in Kentucky?
Trip Assessment Q23. How likely will you be to travel to Kentucky in the future?
Trip Assessment Q21. Would you recommend Kentucky as a vacation destination for your friends or relatives? Q22. Would you recommend Kentucky as a place to conduct business?
Trip Assessment Q25. What features did you like the most about your trip to Kentucky? (Please check ALL that apply.)
Trip Assessment Q26. What features did you like the least about your trip to Kentucky? (Please check ALL that apply.)
Trip Assessment Q20. From your experience, would you say that Kentucky is more expensive, less expensive, or as expensive as you had expected?
Trip Assessment Q16. How would you describe the quality of your accommodations? Do you feel they…
Visitor and Travel Party Demographic Profile Q17. How many times in the last 5 years have you taken a pleasure trip in Kentucky? Q30. How many vacations lasting FIVE (5) OR MORE NIGHTS AWAY FROM HOME, do you take in an average year? Q31. How many short getaway trips lasting AT LEAST ONE (1) BUT NOT MORE THAN FOUR (4) NIGHTS AWAY FROM HOME do you take in an average year?
Visitor and Travel Party Demographic Profile Q27. What is your age please?/Q28. Are you: Male/Female/Q29. Are you: Married/Single/Other Q34. What is your total annual household income before taxes?/Q32. Are you: American Indian/Asian/Black/Hispanic/White/Other
Visitor and Travel Party Demographic Profile Q33. Are you currently a resident of: United States Home Zip Code/Another Country?
Davidson-Peterson Associates 201 Lafayette Center Kennebunk, ME 04043 207.985.1790 www.digitalresearch.com