Download
1 / 13
130 likes | 239 Views
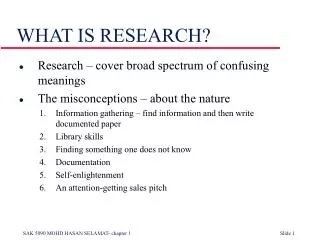
ESRC Research Methods Festival ~ 08 What is Visual research? Jon Prosser, University of Leeds. What is Visual research The four ‘R’s of visual research. Researcher found visual data Researcher created visual data Respondent generated visual data Representation and visual research.

E N D
ESRC Research Methods Festival ~ 08What is Visual research?Jon Prosser, University of Leeds
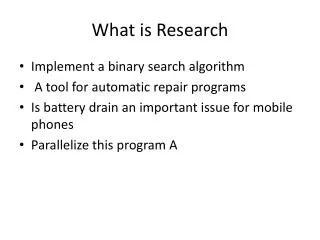
What is Visual researchThe four ‘R’s of visual research • Researcher found visual data • Researcher created visual data • Respondent generated visual data • Representation and visual research
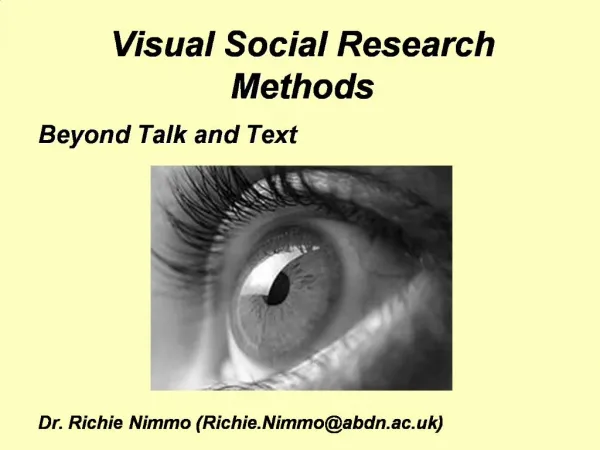
Researcher created visual data:positivist framed ~ eye tracking
Respondent generated visual data:photo/object-elicitation • Photographs, film, video, drawings, or objects are introduced as part of an interview. The aim is to explore the significance or meaning of the images or objects with the respondent. • Useful as ‘icebreakers’ and breaks down the power differential. • Older people are generous with their time and knowledge – pleased you are taking an interest in what they do and their views. • Images/objects act as a neutral or third party
Respondent generated visual data:Photo/object-elicitation • Visual stimuli can be ‘researcher created’ or ‘researcher-generated’ i.e., video, photographs or drawings or ‘researcher found’ and taken from comics or magazines. • Use respondents own cultural artefacts for example favourite clothes, cell phones, icons, symbols or spaces they frequent. • Use respondents own artwork for example drawings, doodles, sketches, posters, photographs or videos they have created ~ maybe also record their creation. • Accessing perceptions through image-elicitation may work by taking an indirect route e.g. old films or photographs. • Use polysemic quality of photographs ~ ‘projective technique’.
Respondent generated visual data Flexible approach adopting a wide range of tools which are modelled on different questions and individually suited to participants’ own preferences: • Time-lines • Self-portraits: draw and write • Diaries (paper, electronic, photographic, video) • Shooting back: participants photographs (video/ walkabout, shadowing.
Respondent generated visual data:self portrait(Courtesy of Anna Bagnoli, Real Life Methods/Timescape, University of Leeds)
Respondent generated visual data:time line(Courtesy of Anna Bagnoli, Real Life Methods/Timescape, University of Leeds)