Download
1 / 39
390 likes | 498 Views
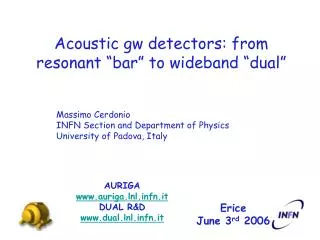
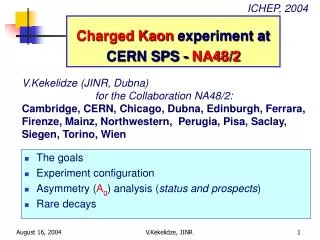
アウリガ. The AURIGA experiment: updates and prospects. バッジョ ルーチョ. BAGGIO Lucio ICRR on behalf of AURIGA collaboration. The AURIGA detector re-started data taking in Dec 2003, after 4 years of research and developement, in order to improve the sensitivity.

E N D
アウリガ The AURIGA experiment: updates and prospects バッジョ ルーチョ BAGGIOLucio ICRR on behalf of AURIGA collaboration The AURIGA detector re-started data taking in Dec 2003, after 4 years of research and developement, in order to improve the sensitivity. A brief overview of the results during last year will be given. Present international collaborations and future prospects will be reviewed. lbaggio@icrr.u-tokyo.ac.jp
Topics of this presentation The AURIGA experiment: run 2 Characteristics and setup of the second run (after Dec 2003) Burst analysis Main issues with burst search: duty cycle, detection efficiency, background events Collaborations Memorandum of Understanding with LIGO, IGEC-2 agreement, contacts with VIRGO Other activities New cryogenic detector with optical transducer; the DUAL project Next steps and Summary New low-frequency suspensions, ultra-cryogenic cooling,
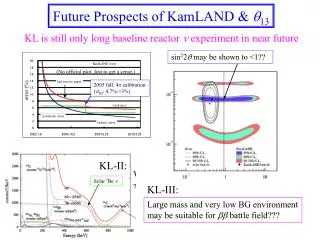
Old & New AURIGA detector 1997/06 Cryogenic failure 1999/12 R&D 2003/12
Main upgrades for the 2nd run • New mechanical suspensions: • attenuation > 360 dB at 1 kHz • FEM modelled • 3 resonant modes operation: • two mechanical modes • one electrical mode • New data analysis and data acquisition: • C++ object oriented code • frame data format • Monte Carlo software injections (internal or MDC) • improved noise matching algorithm • selectable templates “New suspension system for the gravitational wave bar detector AURIGA” (in preparation, to be submitted toRev. Sc. Inst.) 3-mode detection for widening the bandwidth of resonant gravitational wave detectors L. Baggio,M. Bignotto, M. Bonaldi,M. Cerdonio,L. Conti,P. Falferi,N. Liguori,A. Marin,R. Mezzena,A. Ortolan,S. Poggi,G. A. Prodi,F. Salemi,G. Soranzo,L. Taffarello,G. Vedovato,A. Vinante,S. Vitale,and J. P. Zendri (submitted toPhys. Rev D.)
The new suspension system (1) Attenuation & Internal modes frequency (-240DB wide band FEM) (a,b,c,d,e,f) are resonances of the suspension predicted by FEM Quality factor Yield strength (no more than 25% to avoid creeps) Ultracryogenic (0.1 K) compatibility (no thermal short-circuit with 4K container, good thermal link to diluition refrigerator) Vacuum compatibility (10-6mb no rubber)
New transducer & amplifier ■ Two-stage SQUID: Tn(h) = 97 + 78T(K) ● Single stage SQUID: Tn(h) = 1280 +300T(K) Noise Temperature (h) Temperature (K) • three resonant modes operation: • two mechanical modes • one electrical mode • transducer bias field 8 MV/m • new SQUID amplifier : • double stage SQUID • 650 energy resolution at 4.5 K in the detector
Raw data& calibration Mechanical transfer function (response to force applied by a electromechanical actuator attached to the bar) Fully-automatic adaptive noise matching algorithm enbedded in AURIGA data analysis 1 2 3 Frequency [Hz] Fit of the psd with ARMA noise model
Temperature of normal modes Monday morning mode 1 mode 2 mode 3 T [ K ] date 13-15 Nov. 2004
Noise budget expected at 4.5K Shh1/2 < 5·10-21Hz-1/2 over 90 Hz single-sided Shh Very good agreement with noise predictions All these noise sources will scale with temperature
Typical sensitivity to bursts H [Hz-1] 10-21 – [Hz-1] Template: 2004, Nov 13-15 (weekend)
Unexpected non-linear, non stationary noise unmodeled spurious noise peaks within the sensitivity bandwidth • not related to the dynamical linear response ofthe detector • non gaussian statistics • related to mechanical external disturbances • up-conversion of low frequency noise
Epoch vetoes and goodness-of-fit tests with template information, further improvement comes from check of compliance Epoch vetoes from out-of-band information SNR Time [day]
cumulative event rate above threshold false alarm rate [hour-1] after vetoing epoch vetoes (50% of time) vetoed glitches Remaining events after vetoing Background events: approaching the gaussian tail Amplitude distribution of events AURIGA Nov. 13-14, 2004
Duty cycle low-frequency mechanical attenuators
Performances after the upgrade of suspensions 10 days of stationary gaussian operation: < 2 outliers/day ~60% duty cycle for gaussian data Experimental data Simulated data (gaussian noise) 2004 Dec 03-13 (after vetoes) counts SNR
International Gravitational Event Collaboration AURIGA is member of the IGEC since its foundation in 1997. IGEC HP: http://igec.lnl.infn.it Main results in: P. Astoneet al., “Methods and results of the IGEC search for burst gravitational waves in the years1997-2000”, Phys. Rev. D68 (2003) 022001 (also on astro-ph/0302482) IGEC-2 Agreement, Jan 17th 2005 The groups running the four bar detectors ALLEGRO, AURIGA, EXPLORER, NAUTILUS have signed a Letter of Intent to perform a new joint observation starting from 2004 available data. The approach of this new joint observation, will be based on the previous IGEC experience. The observation times of the participating detectors will be coordinated. IGEC-2 is open to agreements with other projects sharing the same scientific objectives.
LIGO-AURIGA MoU A Memorandum of understanding between the experiment AURIGA and the LIGO project has been recently signed, for the purposes of joint data analysis and dissemination of results 2004/07/12 LIGO-M040010-00-M (MoU) 2004/07/12 LIGO-M040191-00-M (Attachment 1) 2004/07/12 LIGO-M040198-00-M (Membership list)
Joint LIGO-AURIGA working group activity STEP-ZERO Outline of the most interesting analysis to be performed based on preliminary study of sensitivity and efficiency of the detectors Document Type LIGO-T040202-00 2004/10/13 Proposal for the First AURIGA-LIGO Joint Analysis L. Baggio, L Cadonati, S. Heng, W. Johnson, A. Mion, S. Poggi, G.A. Prodi, A. Ortolan, F. Salemi, P. Sutton, G.Vedovato, M. Zanolin 1st STEP Cross-correlation between LIGOs (L1, H1 & H2) around the times of AURIGA triggers Analysis of S3 data in progress 2nd STEP Implementation of IGEC-like analysis (self adapting directional coincidence search between candidate event lists from each detector) <in preparation >
LIGO-AURIGA MoU A working group for the joint burst search in LIGO and AURIGA has been formed, with the purpose to: • develop methodologies for bar/interferometer searches, to be tested on real data • time coincidence, triggered based search on a 2-week coincidence period (Dec 24, 2003 – Jan 9, 2004) • explore coherent methods ‘best’ single-sided PSD Simulations and methodological studies are in progress.
White paper on joint analysis Two methods will be explored in parallel: • Method 1: • IGEC style, but with a new definition of consistent amplitude estimator in order to face the radically different spectral densities of the two kind of detectors (interferometers and bars). • To fully exploit IGEC philosophy, as the detectors are not parallel, polarization effects should be taken into account (multiple trials on polarization grid). • Method 2: • No assumptions are made on direction or waveform. • A CorrPower search (see poster) is applied to the LIGO interferometers around the time of the AURIGA triggers. • Efficiency for classes of waveforms and source population is performed through Monte Carlo simulation, LIGO-style (see talks by Zweizig, Yakushin, Klimenko). • The accidental rate (background) is obtained with unphysical time-shifts between data streams.
Optical readout for a bar detector bar Transducer cavity: a Fabry-Perot cavity between the bar and the resonant Reference cavity: a stable Fabry-Perot cavity acting as length reference Laser frequency locked to the reference cavity Working principle: Variations of the transducer cavity length are measured by the stabilized laser bar
Room temperature prototype (2001) The readout mechanics The reference cavity L = 110 mm, FSR = 1.36 GHz, F = 44000
New detector with cryogenic optical transducer (1) Sensitivity predicted at T=4K with already developed technology Goal: acquire data from a cryogenic bar equipped with the optical readout • New transducer mechanics • New bench on top of the bar with cryogenic-compliant motorized mounts for optics • New cryogenic-compliant bar suspension • New clean vacuum system • New anechoic housing for the laser optical bench • Higher finesse cavity The new reference cavity TO DO: New cryogenic bar housing (in progress) Transducer with optimized mass (after first tests)
New detector with cryogenic optical transducer (2) cables and optical phiber thermalization Lhe vessel adaptater & pre-attenuation single-column cryogenic suspension Direct thermal links from the Lhe vessel Roadmap: April: delivery of the cryogenic container Summer: assembling and testing Autumn: commissioning of the complete detector 2006: first measures
Two possible configurations: DUAL: concept Measurement of differential deformations of two nested bodies, resonating at different frequencies and both sensitive to the gw signal Dual sphere PRL 87 (2001) 031101 antenna pattern: isotropic Dual cylinder PRD 68 (2003) 102004 antenna pattern: identical to that of 2 interferometers at 45 degrees with respect to each other • In the intermediate frequency range: • the outer resonator is driven above resonance, • the inner resonator is driven below resonance • → phase difference of In the differential measurement: → the signals sum up → the readout back action noise subtracts
DUAL: predicted sensitivity Q/T > 2 108 K-1 , Standard Quantum Limit • Current activity: • Detector design • seismic noise control (pre-filtering) • high frequency (in band) mechanical • vibration filtering • underground operation • Readout system • Requirement: ~ 5x10-23 m/√Hz • Two concurrent studies: capacitive (+SQUID) and optical (folded Fabry-Perot, Phys. Lett. A 309, 15 (2003) ) readout Mo Dual16.4 ton height 2.3 m Ø 0.94m SiC Dual 62.2 ton height 3 m Ø 2.9m
New low frequency vibrational damping New external suspensions: “fast” assembling in April-June Air springs: effective above1-2 Hz
Further steps to increase the bandwidth T = 0.1K T = 0.1K and bias field x2.5