Download
1 / 13
140 likes | 284 Views
R. Friedel, Y. Chen, G. Reeves, T. Cayton ISR-1, Los Alamos National Laboratory, USA Yuri Shprits University of California, Los Angeles, USA. Pitch angle evolution of energetic electrons at geosynchronous orbit during disturbed times. Contents. Rationale

E N D
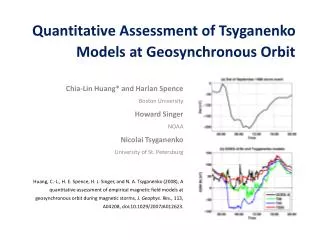
R. Friedel, Y. Chen, G. Reeves, T. Cayton ISR-1, Los Alamos National Laboratory, USA Yuri Shprits University of California, Los Angeles, USA Pitch angle evolution of energetic electrons at geosynchronous orbit during disturbed times
Contents • Rationale • Geosynchronous pitch angle distributions • Instrumentation and Data • Drift shell splitting example and explanation • Mapping to constant L* = 6.5 • Assumptions • Demonstration of method • Quiet time test of method (10-13 December 2002) • Application to small relativistic electron event • August 2-5, 2002 • Theoretical predictions • Summary/Conclusion
Rationale • Energetic electron pitch angle distributions show clear local time variations due to the asymmetry of the Earth’s field: Drift shell splitting L* = f (pitch angle) • These “geometric” effects may mask the changes that may be due to in-situ acceleration or pitch angle scattering processes. • We “remove” here the geometric effects by mapping the observed pitch angle distributions to a fixed 3rd (L*,Φ) adiabatic invariant preserving the 1st (μ) and 2nd (K,J) adiabatic invariants.
Geosynchronous Instrumentation and Data • Data is presented from the relativistic electron channels of the LANL SOPA instrument – 50 keV – 1.5 MeV. • As there is no magnetometer on the LANL GEO spacecraft, the magnetic field direction is inferred using the MPA plasma measurements by deducing the symmetry axis of the pressure tensor (Thomsen et al, 1996). • GEO spacecraft have a 10 sec spin period. SOPA data sampling is at 0.16 seconds. Data is collected in 32 azimuthal bins averaged over 10 minutes. • Pitch angle resolved GEO data is available for LANL-97a, 1991-080 and 1990-095 for most of Jul 2002 – Dec 2003.
Geosynchronous Orbit Drift shell splitting example and explanation
Mapping to L*=6.5Assumptions Drift shell splitting at geo orbit leads to observations over L* = 6 – 7. We map observations to a fixed L* =6.5 at constant µ (1st) and K (2nd) invariant using the following assumptions: • Phase space density gradients near GEO are flat or small (SCATHA [Fennell] and GEO/Polar [Chen] observations). • Over this small range of L* we can approximate our µ mapping using a dipolar approximation. • The change in the mapping of K to pitch angle is over this range of L* is negligible.
At satellite, different pitch angles map to different L*. Example of mapping satellite near midnight Mapping to L*=6.5Demonstration of method near midnight
Mapping to L*=6.5Map at constant K or pitch angle? We tested the change in the 2nd invariant K to pitch angle mapping at a variety of local times for L*=6 and L*=7, the maximum mapping needed in this study. Changes in pitch angle at constant K are < 3 Deg, which below our 10 deg pitch angle resolution. Near geosynchronous orbit we thus are safe to map at constant pitch angle.
Pitch Angle MappingQuiet time test of Method - Olson Pfitzer Model
Particle Loss – field aligned electrons lost Coincident with cold dense plasma Signature at MPA -> conditions for EMIC waves Continued Recovery Original PA -> night-side butterfly Mapped PA -> 90o peaked at times Butterfly not completely gone -> possible PSD gradient 1st Recovery Original PA -> slight night-side butterfly Mapped PA -> 90o peaked Average of all available LANL GEO data 500 – 1500 KeV Original Pitch Angle Distribution 750 KeV Orig. Normalized Pitch Angle Distribution 750 KeV Map. Normalized Pitch Angle Distribution 750 KeV LANL MPA Plasma Data Ion Spectra MPA inferred Mag Field Dir 0o = To earth 90o = North Red = T01s model L* at 90o to 10o PA MLT in Red T01 storm model Pitch angle MappingSmall rel. electron Event August 2-5, 2002
Evolution of Pitch Angle Distributions – Modeling effects of Waves - UCLA Addition of EMIC waves leads to rapid loss of electrons at energies down to ~0.5 MeV Higher pitch angles are affected for higher energies < 60o ~1 MeV < 30o ~400 keV
LANL GEO Pitch Angle observations at all energies 50 keV – 1.5 MeV Losses to <60o for ~1MeV Losses become less severe as energy decreases Observations are roughly consistent with EMIC theory and modeling
Summary / Conclusion • Pitch angle mapping seems to work and can reveal the “real” PA distribution dynamics • We show that method works in principle – however many assumptions probably violated during very active periods • For the week relativistic electron event of August 2-5, 2002: • the pitch angle distribution seems to show evidence of acceleration processes (-> peaked at 90o) • The loss period at the end of the event is clearly associated with cold dense plasma and losses are due to precipitation -> field aligned electrons vanish • Association with EMIC waves: Detailed evolution modeling of PA distributions shows roughly consistent behavior with data.