Download
1 / 51
510 likes | 602 Views
Topic 2: Ecosystems. 2.1 Structure. CO 2. O 2. Nutrients. Ecology. Ecology is the study of the relationships between organisms and their physical and biotic environment:

E N D
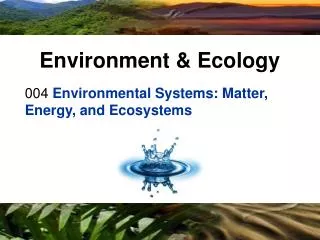
Topic 2: Ecosystems 2.1 Structure
CO2 O2 Nutrients Ecology • Ecology is the study of the relationships between organisms and their physical and biotic environment: • Relationships involve interactions with the physical world as well as interrelationships with other species and individuals of the same species.
Physical environment Community Components of an Ecosystem • A biome is a large geographical regioncomprising natural units called ecosystems. • An ecosystem encompasses the physicalenvironment and the community.
Abiotic(physical) factors are the influences of the non-living parts of the ecosystem. Abiotic factors atmospheresoilwater wind speed wind direction pH, salinity, temperature, humidity, precipitation, water pressure, and light intensity and quality. Bioticfactors are the influences of the living parts of the ecosystem Biotic factors Competitors, symbionts, predators, parasites, pathogens Ecosystem Physical environment Community
Trophic Structure 1 • Every ecosystem has a trophicstructure: a hierarchy of feeding relationships which determines the pathways for energy flow and nutrient cycling. • Species are assigned to trophic levels on the basis of their nutrition. • Producers (P) occupy the first trophic level and directly or indirectly support all other levels. Producers derive their energy from the sun in most cases.
Producer (P) Consumer (C1) Consumer (C2) Consumer (C3) Trophic Structure 2 • All organisms other than producers are consumers (C). • Consumers are ranked according to the trophic level they occupy. First order (or primary) consumers (herbivores), rely directly on producers for their energy. • A special class of consumers, the detritivores, derive their energy from the detritus representing all trophic levels. • Photosynthetic productivity (the amount of food generated per unit time through photosynthesis) sets the limit for the energy budget of an ecosystem.
Respiration Heat given off in the process of daily living. Growth and new offspring New offspring as well as new branches and leaves. Eaten by consumers Some tissue eaten by herbivores and omnivores. Wastes Metabolic waste products are released. Reflected light Unused solar radiation is reflected off the surface of the organism. Dead tissue Producers • Producers are able to manufacture their food from simple inorganic substances (e.g. CO2). Producers include green plants, algae and other photosynthetic protists, and some bacteria. Producers Solar radiation Death Some tissue is not eaten by consumers and becomes food for decomposers.
Respiration Heat given off in the process of daily living. Growth and reproduction New offspring as well as growth and weight gain. Eaten by consumers Some tissue eaten by carnivores and omnivores. Wastes Metabolic waste products are released (e.g. urine, feces, CO2) Food Consumers obtain their energy from a variety of sources: plant tissues (herbivores), animal tissues (carnivores), plant and animal tissues (omnivores), dead organic matter or detritus (detritivores and decomposers). Dead tissue Consumers • Consumers are organisms that feed on autotrophs or on other heterotrophs to obtain their energy. • Includes: animals, heterotrophicprotists, and some bacteria. Consumers Death Some tissue not eaten by consumers becomes food for detritivores and decomposers.
Respiration Heat given off in the process of daily living. Growth and reproduction New tissue created, mostly in the form of new offspring. Producer tissue Nutrients released from dead tissues are absorbed by producers. Death Decomposers die; their tissue is broken down by other decomposers and detritivores Wastes Metabolic waste products are released. Dead tissue Dead tissue of producers Dead tissue of consumers Dead tissue of decomposers Decomposers • Decomposers are consumers that obtain their nutrients from the breakdown of dead organic matter. They include fungi and soil bacteria. Decomposers
Organisation of Trophic Levels • Trophic structure can be described by trophic level or consumer level:
The sequence of organisms, each of which is a source of food for the next, is called a food chain. Food chains commonly have four links but seldom more than six. In food chains the arrows go from food to feeder. Organisms whose food is obtained through the same number of links belong to the same trophic level. Examples of food chains include: Food Chains 2° carnivore 1° carnivore Producer (P) Herbivore whelk seagull cat’s eye seaweed aquatic macrophyte brown trout freshwater crayfish kingfisher
Heat Heat Heat Heat Heat Food Chain Energy Flow • Energy is lost as heat from each trophic level via respiration. • Dead organisms at each level are decomposed. • Some secondary consumers feed directly off decomposer organisms.
Plant material consumed by caterpillar 200 J 100 J 33 J 67 J Cellular respiration Feces Growth Ecological Efficiency • The percentage of energy transferred from one trophic level to the next varies between 5% and 20% and is called the ecological efficiency. • An average figure of 10% is often used. This ten percent law states that the total energy content of a trophic level in an ecosystem is only about one-tenth that of the preceding level.
Energy Flow in Ecosystems • Energy flow into and out of each trophic level in a food chain can be represented on a diagram using arrows of different sizes to represent the different amounts of energy lost from particular levels. • The energy available to each trophic level will always equal the amount entering that trophic level, minus total losses to that level.
Energy Flow Diagrams • The diagram illustrates energy flow through a hypothetical ecosystem.
Food Webs • Some consumers (particularly ‘top’ carnivores and omnivores) may feed at several different trophic levels, and many herbivores eat many plant species. • For example, moose feed on grasses, birch, aspen, firs, and aquatic plants. • The different food chains in an ecosystem therefore tend to form complex webs of feeding interactions called a food web.
A Simple Lake Food Web • This lake food web includes only a limited number of organisms, and only two producers. Even with these restrictions, the web is complex.
Ecological Pyramids 1 • Trophic levels can be compared by determining the number, biomass, or energy content of individuals at each level. • This information can be presented as an ecological pyramid. • The base of each pyramid represents the producers and the subsequent trophic levels are added on top in their ‘feeding sequence’.
Pyramid of numbers Pyramid of biomass Pyramid of energy Ecological Pyramids 2 • Various types of pyramid are used to describe different aspects of an ecosystem’s trophic structure: • Pyramids of numbers: In which the size of each tier is proportional to the number of individuals present at each trophic level. • Pyramids of biomass: Each tier represents the total dry weight of organisms at each trophic level. • Pyramids of energy (production): The size of each tier is proportional to the production (e.g. in kJ) of each trophic level.
Forest Grassland Pyramids of Numbers • In a typical pyramid of numbers, the number of individuals supported by the ecosystem at successive trophic levels declines progressively. • This reflects the fact that the smaller biomass of top level consumers tends to be concentrated in a relatively small number of large animals. • There are some exceptions. In some forests a few producers (of a very large size) may support a larger number of consumers, and the pyramid is inverted. This also occurs in plant/parasite food webs.
A Florida bog community The English Channel Pyramids of Biomass • In pyramids of biomass, dry weight is usuallyused as the measure of mass because the water content of organisms varies. • Organism size is taken into account so meaningful comparisons of different trophic levels are possible. • Biomass pyramids may be inverted in some systems (e.g. in some plankton communities) because the algal (producer) biomass at any one time is low, but the algae are reproducing rapidly and have a high productivity.
Pyramids of Energy • Pyramids of energy (or production) are often very similar in appearance to pyramids of biomass. • The energy content at each trophic level is generally comparable to the biomass because similar amounts of dry biomass tend to have about the same energy content. • This example illustrates the similarity between pyramids of biomass (gm-2) and energy (kJ) in a freshwater lake community. During warm months, when algal turnover time is short, pyramids of energy and biomass may be inverted. Zooplankton (C1)
Bioaccumulation Biomagnification of DDT in an aquatic ecosystem • Bioaccumulation (also called biological magnification) occurs when highly persistent pesticides, which cannot be metabolized or excreted, are stored and accumulate in the fatty tissues of the body. • There is a progressive concentration of the pesticides with increasing trophic level; higher order consumers are at greater risk because they eat a large number of lower order consumers.
Species • A group of similar organisms whose members freely interbreed • Population • A group of organisms of the same species that occupy that live in the same area at the same time • Ecosystem • A community and its physical (abiotic) environment Biosphere Ecosystems Communities Populations Organisms
Communities • A community is a naturally occurring group of organisms living together as an ecological entity; the biological part of the ecosystem. A nudibranch snail feeding on rock encrusting organisms
Habitat • An organism’s habitat is the physical place or environment in which it lives. • Organisms show a preference for a particular habitat type, but some are more specific in their requirements than others. Most frogs, like this leopard frog, live in or near fresh water, but a few can survive in arid habitats. Lichens are found on rocks, trees, and bare ground.
Physical Conditions • The physical conditions influence the habitat in which an organism lives. These include: • substrate • humidity • sunlight • temperature • salinity • pH (acidity) • exposure • altitude • depth • Each abiotic (or physical) factor may be well suited to the organism or it may present it with problems to overcome.
Tolerance range Optimum range Number of organisms Unavailable niche Marginal niche Preferred niche Marginal niche Unavailable niche Law of Tolerance • The law of tolerance states that “For each abiotic factor, an organism has a range of tolerances within which it can survive.” Examples of abiotic factors that influence size of the realized niche:
Niche An organisms particular role or how it makes its living. Ex- the food it eats, how it gets its food, what other organism use it as food. When and how an organism reproduces. Physical conditions required for survival 2 Species can not occupy the same niche!
Habitat Adaptations Activity patterns Presence of other organisms Physical conditions Ecological Niche • The ecological niche describes the functional position of an organism in its environment. • A niche comprises: • the habitat in which the organism lives. • the organism’s activity pattern: the periods of time during which it is active. • the resources it obtainsfrom the habitat.
Species Interactions • No organism exists in isolation. Each participates in interactions with other organisms and with the abiotic components of the environment. • Species interactions may involve only occasional or indirect contact (predation or competition) or they may involve a close association between species. Symbiosis is a term that encompasses a variety of such close associations, including parasitism (a form of exploitation), mutualism, and commensalism. Canopy tree with symbionts attached Oxpecker birds on buffalo
Parasitism • Many animal taxa have representatives that have adopted a parasitic lifestyle. • Parasites occur more commonly in some taxa than in others. Insects, some annelids, and flatworms have many parasitic representatives. • Parasites live in or on a host organism. The host is always harmed by the presence of the parasite, but it is not usually killed. Both parasite and host show adaptations to the relationship. • Parasites may live externally on a host as ectoparasites, or within the host’s body as endoparasites. Tick ectoparasite on bird wing Many birds and mammals use dust bathing to rid themselves of external parasites
Ectoparasites • Ectoparasites, such as ticks, mites, lice, bed bugs, and fleas, live attached to the outside of the host, where they suck body fluids, cause irritation, and may act as vectors for pathogens. • Insect vectors include human lice, rat fleas, mosquitoes and tsetse flies. Bed bug (Cimex lectularis) Human flea (Pulex irritans) Head louse (Pediculus humanus) Mosquito vector for Dengue fever (Aedes albopictus)
Endoparasites • In many endoparasites, a primary host (in which the parasite becomes sexually mature) and one or more intermediate hosts (which usually house larval stages) are required to complete the life cycle. • Endoparasitic species such as the pork tapeworm, Taenia solium, are highly specialized to exploit the resources of the host. • Adaptations, such as specialized mouthparts and lack of a digestive tract, enable them to spend their life inside the intestines of their vertebrate hosts. Taenia scolex (head region) Taeniaproglottid (reproductive segment) Horsegut nematode Sheep liver fluke
Mutualistic Relationships • Mutualistic relationships occur between some birds (such as oxpeckers) and large herbivores (such as zebra, Cape buffalo, and rhinoceros). The herbivore is cleaned of parasites and the oxpecker gains access to food. • Lichens are an obligate mutualism between a fungus and either a green alga or a cynobacterium. The fungus obtains organic carbon from the alga. The alga obtains water and nutrient salts from the fungus. Cape buffalo and oxpecker birds Lichen: an obligate mutualism
Commensal Relationships • In commensal relationships, one party (the commensal) benefits, while the host is unaffected. • Epiphytes (perching plants) gain access to a better position in the forest canopy, with more light for photosynthesis, but do no harm to the host tree. • Commensal anemone shrimps (Periclimenes spp.) live within the tentacles of host sea anemones. The shrimp gains protection from predators, but the anemone is neither harmed nor benefitted.
Amensalism • Amensalism describes the situation where the presence of one species has a harmful effect on the other, but is not itself affected by the association. • In this respect, it is opposite to the relationship between a commensal and its host. • Grazing mammals trample and destroy vegetation around waterholes, creating bare zones. The mammals are unaffected by the loss as they go there primarily to drink and not to feed.
Exploitation • Exploitation describes relationships where one species benefits at the expense of another. It includes several familiar interactions: • Predation: Predator kills the prey outright, e.g. lions hunting zebra. • Herbivory: The herbivore feeds on, but usually does not kill, the plant, e.g. zebra grazing on grass. • Parasitism: The parasite does not usually kill its host, e.g. ticks feeding on the blood of a zebra.
Plant Parasites • A great diversity of plant parasites exist. Some depend only partly on their host plant for nutrition; they are photosynthetic but utilize the host’s nutrients, e.g. mistletoe. • Others are entirely parasitic and are unable to photosynthesize, e.g. cancer root (Conopholis americana) dodder, and wood rose (Dactylanthustaylorii). Cancer root (top) and wood rose are holoparasitic and dependent entirely on the host plant. MistletoePhoradendren spp. are hemiparasites; photosynthesizing but lack their own roots and rob their host plant of water and nutrients.
Antibiosis • Antibiosis describes the chemical inhibition of one party by another. One party is harmed; the other is unaffected, or may even benefit. • In allelopathy, one plant releases toxic compounds (e.g. phenols or alkaloids) which inhibit the growth of nearby plants. Allelopathic plants include black walnut, swamp chestnut oak, and eucalyptus and neem trees. In cases of autotoxicity, a parent plant produces chemicals to inhibit the growth of its own seedlings. • Fungi produce antibiotics to inhibit the growth of bacteria. Inhibition around a eucalypt Many moulds produce antibiotics
Competition • Competition is one of the most familiar of species relationships. It occurs both within (intraspecific) and between (interspecific) species. • Individuals compete for resources such as food, space, and mates. In all cases of competition, both parties (the competitors) are harmed to varying extents by the interaction. • Neighboring plants compete for light, water, and nutrients. Interactions involving competition between animals for food are dominated by the largest, most aggressive species (or individuals).
Intraspecific Competition • Environmental resources are finite. Competition within species for resources increases as the population grows. At carrying capacity (K), it reduces the per capita growth rate to zero. • When the demand for a resource (e.g. water, food, nesting sites, light) exceeds supply, that resource becomes a limiting factor. Animals compete for resources such as water (left) or mates (right), especially when these are in short supply or access to them is restricted.
Responses to Competition 1 • Populations respond to resourcelimitation by reducing their population growth rate through lower natality or highermortality. • Individuals respond variably to resource limitation. • In most cases, food shortage reduces both individual growth rate and survival, as well as population growth. • In many invertebrates and some vertebrates such as frogs, individuals reduce growth rate and mature at a smaller size. Tadpoles metamorphosing into frogs Trout are smaller when food is limited
Responses to Competition 2 • In some species, including frogs and butterflies, adults and juveniles reduce the intensity of intraspecific competition by exploiting different food resources. There may even be one or more non-feeding stages. Caterpillars of the Atlas moth feed on a variety of tree species, but the adults do not feed. The adults of other species feed on nectar. The aquatic tadpoles frogs feed on algae whereas the adults are carnivorous and feed exclusively on live invertebrates.
Competition for Mates • Intraspecific competition may be for mates or breedingsites. Ritualized display behavior and exaggerated coloration may be used to compete successfully. • During the breeding season, some species occupy small territories called leks, which are used solely for courtship display. The best leks attract the most females to the area. • In some vertebrates, territoriality spaces individuals apart so that only those with adequate resources are able to breed. The egret’s courtship display exposes the lacy breeding plumage Topi use leks for courtship
Golden Eagle Competition • Territoriality in birds and other animals is usually a consequence of intraspecific competition. This often produces a pattern of uniform distribution over an area of suitable habitat. Golden eagle (Aquila chrysaetos) breeding territories in Northern Scotland,1967 Single site Breeding, year of survey 1967 Group of sites belonging to one pair Marginal site, not regularly occupied Low ground unsuitable for breeding eagles
Competition in Groups • Animals may form rather loose associations or live in well organized social groups. The nature of the competition is different in each case: • Scramble competition occurs when members of the same species compete directly for an available resource. Some or all of the individuals may not acquire adequate resources. • Contest competition occurs in social groups with hierarchical structures. Dominantindividuals receive adequate resources, but subordinate individuals must contest what remains. Scramble competition in caterpillars Contest competition in wolves
Competition in Tadpoles • In tank populations of tadpoles (Rana tigrina), individual growth rate declines as the density increases from 5 to 160 individuals (in the same sized space). At high densities, tadpoles grow more slowly, taking longer to reach the minimum size for metamorphosis and decreasing their chances of successfully reaching adulthood. Scramble competition in tadpoles of Rana tigrina Minimum size for metamorphosis: 0.75 g High density increases scramble competition. At high densities, no tadpoles have adequate food.