Download

1 / 16
160 likes | 301 Views
Accessing Air Quality Lessons on MY NASA DATA mynasadata@lists.nasa.gov. Search “Air Quality”. Select Top Link. http://mynasadata.larc.nasa.gov/air-quality-and-composition/. Lessons. Data Plots & Access. Looking at Seasonal Variability in NO2.

E N D
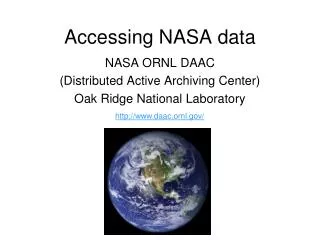
Accessing Air Quality Lessons on MY NASA DATAmynasadata@lists.nasa.gov
http://mynasadata.larc.nasa.gov/air-quality-and-composition/ Lessons
Lesson Background Background: The dataset used in this lesson is monthly averages of NO2 as measured from NASA’s EOS Aura spacecraft. NO2 is measured using the Ozone Monitoring Instrument (OMI). OMI is a nadir-pointing instrument that measures trace gases in a column of air directly below the spacecraft. NO2 concentrations are measured in number densities, or the amount of NO2 molecules found in a cubic centimeter of air. Alternately, units of parts per billion can be used, as in the graph at the top of the page. This tells how many NO2 molecules would be found in a sample containing a billion molecules of air. The OMI instrument measures the amount of NO2 in the entire vertical column of air below it, thus the units for OMI measurements are molecules per square centimeter (of the surface). See the units page for more explanation of this. Measurements of nitrogen dioxide (NO2) [in blue on graph] and ozone (O3) [in green] indicate rise and fall over a 48-hour period. Nitrogen dioxide participates in ozone formation, so after its concentrations peak, so do concentrations of ozone. Ozone concentrations peak during hours of maximum sunlight, around the middle of the day. (Graph courtesy William Brune, Penn State Earth Systems Science Center)
Part 1: Examine NO2 for a Region • Step 1 – Access “Live Access Server” from Lesson Links or left toolbar • Step 2- Select “Advanced Edition”
Set Scale for Comparison • Click “Set Plot Options” Button • In “Contour Fill” type: (0,450,50) • Click “Ok” • Click “Update Plot” Button
Questions • What seasonal differences do you observe? • Are NO2 values in January higher or lower then June? • Why? • If you graphed the data for a given location, what sort of graph would you expect?
Part 2: Create TimeSeries of a Location • Select “TimeSeries” • Select Date Range • Enter Location Lat/Lon • Click “Update Plot”