Download
1 / 57
680 likes | 1.84k Views
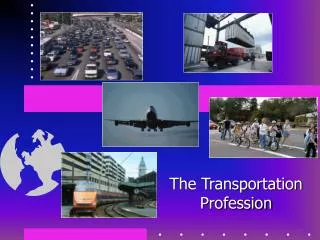
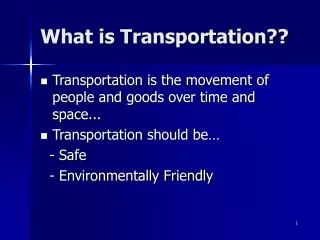
What is Transportation??. Transportation is the movement of people and goods over time and space... Transportation should be… - Safe - Environmentally Friendly. SAFE???. Source: http://inventorspot.com/what_is_the_future_of_transportation. SAFE???.

E N D
What is Transportation?? • Transportation is the movement of people and goods over time and space... • Transportation should be… - Safe - Environmentally Friendly
SAFE??? Source: http://inventorspot.com/what_is_the_future_of_transportation
SAFE??? Source: http://inventorspot.com/what_is_the_future_of_transportation
Emissions Emissions from Vehicles ENVIRONMENTALLY FRIENDLY ????
Motorized Non-Motorized Transportation Modes • Biking • Walking • Automobile • Transit • Bus • Rail • Rapid Transit (subway)
Development of Transportation Modes Ridership Automobile Bus Electric Tramway Cable car Horse-drawn Omni bus Time 1860 1893 1923 1948
Life Cycle of a Transportation Mode Ridership Growth to Maturity Decline Decline Innovation Period Nostalgia Nostalgia Time
Hybrid Cars Environmentally Friendly
Hybrid Cars Gasoline power + Electric power
Year: 2008 Speed: ~ 500 km/h History of Transportation Year: 1804 Speed: 8 km/h
In Japan nearly 40 years, In Europe nearly 25 years Railway Long distance Very High speed Locomotives High speed Interurban Regional Tram Metro Speed
320 km/h 300 km/h 230 km/h TGV Duplex (France) AVE (Spain) New Pendolino (Italy) 200 km/h 300 km/h Virgin West Coast Pendolino (UK) KTX (South Korea)
1) Land -Railway -Highway -Pipeline 3 ways we transport on planet earth:
2) Sea 3) Air
Why people like cars? • We like the cars • It often (but not always) is the fastest mode, depending on levels of congestion, time of day and the available alternatives • Privacy • Automobiles suggest that you are at a higher level of society • People simply enjoy the sensation of driving
Importance of Transportation • Necessary for economic growth, but not sufficient - The speed, cost, and capabilities of available transportation have a significant economic impact on an area - Countries with better/advanced transportation networks and services are leaders in industry and commerce USA, Japan, Germany, ...
Importance of Transportation • Determines the location and character of cities and regions by interacting with land use (e.g. silk road) • National security
Components of the Transportation System • Infrastructure (supply): -Physical facilities: highways, railroads, ports -Transfer points: parking areas, driveways -Supporting elements: signals, signs, safety hardware, etc. • Vehicles (demand): Planes, trains, autos, buses, ships, trucks • Operators/users: Drivers, pilots, freight, passengers
What is Transportation Engineering • The engineering profession is involved in all aspects of -Aeronautical (aircraft) -Chemical (fuel) -Mechanical (vehicles) -Electrical (communications, control system) -Civil (development of facilities and manage demand)
Transportation Engineering • One of the specialty areas of civil engineering - Development of facilities for the movement of goods and people - Planning, design, operation and maintenance • People oriented
Multi-disciplinary -Economic -Environmental -Planning -Statistics -Law -Psychology & human factors -Public administration • Problems ==> solutions
Areas of Transportation Engineering • Transportation Planning • Traffic Operations (signs, signals,..) • Roadway Geometric Design • Pavement Engineering • Railway Engineering • Design and Planning of Airports
Development of Transportation Network • Planning • Design • Construction
What is transportation planning? Activities that: 1. Identify problems, gather and analyze data 2. Forecast future traffic demands and estimate the environmental and social impacts 3. Evaluate alternatives and determine the alternative that meet the requirements and constraints of the problem at the lowest cost
Demographic Data Step 1: Trip Generation TransportationNetwork Step 2: Trip Distribution Step 3: Mode Choice Step 4: Trip/ Traffic Assignment The 4 step transport planning process • OUTPUT • Estimated trips • Estimated modal shares • Estimated travel speeds • Estimated travel delays
Trip generation Potential Trip Generation • Decision to travel for a specific purpose (e.g. eat lunch) -How much do people use the transport system? -Why do people use the transport system? -Where can different types of activities be satisfied?
Trip distribution Travel demand Trip Distribution • Choice of destination (a particular restaurant? The nearest restaurant?) -Given a location, where do people go to satisfy demand for an activity type? -Determine origin and destination of trips
Mode choice Transport demand Mode Choice • How do people use the transport system? • What modes do they choose (transit, walk, carpool, drive alone,…)? • How do they react to varying transport service quality?
Route choice Assigned flows Trip / Traffic Assignment • How do people use the transport system? • Given a mode, which route do they choose (e.g. E-5..)? • Which parts of the transport system do they use?
Demographic Data • Household size • Income level • Autos per household
Network Data • Highway network • Transit network
Capacity Restraint for Highways • A qualitative measure describing operational conditions within a traffic stream and their perception by drivers and/or passengers • Different for different facilities (freeway, multilane, 2-lane rural, signals)
Freeways: Capacity (Free-Flow Speed) 2,400 pcphpl (70 mph) 2,350 pcphpl (65 mph) 2,300 pcphpl (60 mph) 2,250 pcphpl (55 mph) pcphpl=passenger cars per hour per lane Multilane Suburban/Rural 2,200 pcphpl (60 mph) 2,100 (55 mph) 2,000 (50 mph) 1,900 (45 mph) 2-lane rural – 2,800 pcph Signal – 1,900 pcphgpl Ideal Capacity
Level of Service (LOS) • Chief measure of “quality of service” • Describes operational conditions within a traffic stream • Does not include safety • Different measures for different facilities • 6 measures A through F
Definition- Free Flow Speed • Free-Flow Speed (FFS) • The mean speed of passenger cars that can be accommodated under low to moderate flow rates on a uniform freeway segment under prevailing roadway and traffic conditions
LOS A • Free flow conditions • Vehicles are unimpeded in their ability to maneuver within the traffic stream
LOS B • Flow reasonably free • Ability to maneuver is slightly restricted • General level of physical and psychological comfort provided to drivers is high
LOS C • Flow at or near FFS • Freedom to maneuver is noticeably restricted • Lane changes more difficult • Queues may form behind significant blockage
LOS D • Speeds begin to decline with increasing flow • Freedom to maneuver is noticeably limited • Drivers experience physical and psychological discomfort • Even minor incidents cause queuing
LOS E • Capacity • Vehicles are closely spaced • Disruptions such as lane changes can cause a disruption wave that propagates throughout the upstream traffic flow
LOS F • Breakdown or forced flow • Occurs when: • Traffic incidents cause a temporary reduction in capacity • At points of recurring congestion, such as merge or weaving segments • In forecast situations, projected flow (demand) exceeds estimated capacity
Design Level of Service • This is the desired quality of traffic conditions from a driver’s perspective (used to determine number of lanes) • Design LOS is higher for rural areas • LOS is higher for level/rolling than mountainous terrain • Other factors include: adjacent land use type and development intensity, environmental factors, and aesthetic and historic values
Design Decision What can we change in a design to provide an acceptable LOS? • Lateral clearance :Distance to fixed objects Assumes • >= 6 feet (1.8 m) from right edge of travel lanes to obstruction • >= 6 feet (1.8 m) from left edge of travel lane to object in median • Lane width • Number of lanes
Highway Design • Problem Statement • Objective and Constraints • Horizontal Alignment • Vertical Alignment • Mass Diagram • Final Report - Blueprint for construction
Problem Lombard Street, San Francisco, CA Highway in west China
Constraints • Environmental -Wetland, ponds and creeks. • Geometric - 90m flat grade for starting and ending points. - Simple horizontal and vertical curve • Safety - Maximum grade - Minimum radius - Enough stopping sight distance • Budget - Maximum cut-and-fill depth - Mass balance