Download
1 / 5
50 likes | 138 Views
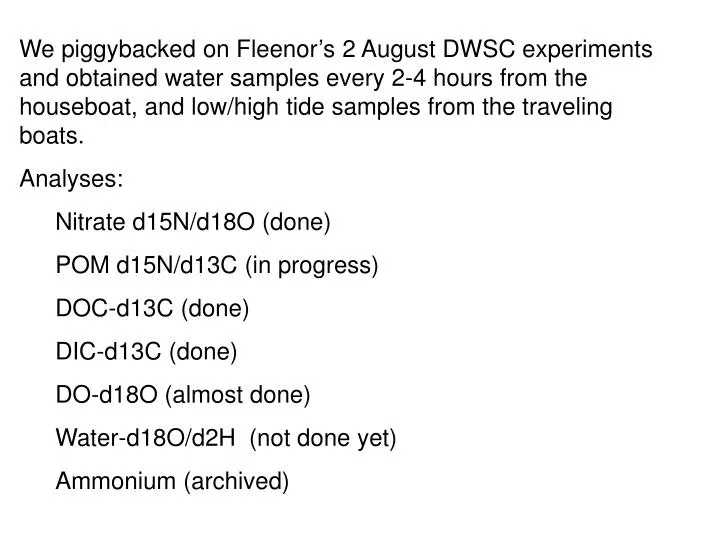
We piggybacked on Fleenor’s 2 August DWSC experiments and obtained water samples every 2-4 hours from the houseboat, and low/high tide samples from the traveling boats. Analyses: Nitrate d15N/d18O (done) POM d15N/d13C (in progress) DOC-d13C (done) DIC-d13C (done) DO-d18O (almost done)

E N D
We piggybacked on Fleenor’s 2 August DWSC experiments and obtained water samples every 2-4 hours from the houseboat, and low/high tide samples from the traveling boats. • Analyses: • Nitrate d15N/d18O (done) • POM d15N/d13C (in progress) • DOC-d13C (done) • DIC-d13C (done) • DO-d18O (almost done) • Water-d18O/d2H (not done yet) • Ammonium (archived)
The d18O of DO reflects the ratio of productivity to respiration in the water column Respiration (consumption) dilution Photosynthesis (addition) (from Len Wassenaar, 2001)
48-Hour Diel Cycle of DO concentrations and d18O • Typical pattern found in small lakes and streams: • 140 % range in O2 saturation in 24 hours • 17 ‰ range in d18O of DO over 24 hours (are currently giving this a try at a few USGS studies in CA, OR, WA) (from Len Wassenaar, 2001)
How to tease out the main controls on DO levels in the DWSC (and elsewhere): • Photosynthesis (P) • Respiration (R) • Nitrification (N) R N d18O P DO P N d13C These processes will probably also cause diagnostic changes in the d18O/d15N of nitrate and the d15N/d13C of POM R DIC
Cartoon showing how isotopic compositions of O2, NO3, and POM can be used to separate the effects of nitrification of ammonium vs respiration of algae as BOD reactions d15NNO3 = 12‰ d15NPOM = 11‰ d15NNO3 = 15‰ d15NPOM = 10‰ d18OO2 = 23‰ d18OO2 = 25‰ O2 = 1.0 O2 = 0.9 d18OO2 = 27‰ O2 = 0.7 d18OO2 = 29‰ flow O2 = 0.6 Treatment plant Water samples would be collected along a grid, and at several depths