Download
1 / 36
360 likes | 521 Views
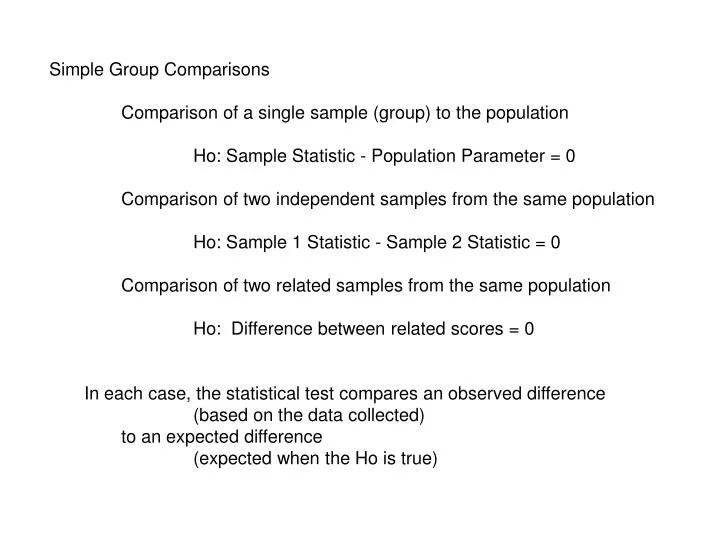
Simple Group Comparisons Comparison of a single sample (group) to the population Ho: Sample Statistic - Population Parameter = 0 Comparison of two independent samples from the same population Ho: Sample 1 Statistic - Sample 2 Statistic = 0

E N D
Simple Group Comparisons Comparison of a single sample (group) to the population Ho: Sample Statistic - Population Parameter = 0 Comparison of two independent samples from the same population Ho: Sample 1 Statistic - Sample 2 Statistic = 0 Comparison of two related samples from the same population Ho: Difference between related scores = 0 In each case, the statistical test compares an observed difference (based on the data collected) to an expected difference (expected when the Ho is true)
Research question Did students admitted in 1982 score better than the national norm on the GRE tests? GRE Verbal GRE Quantitative
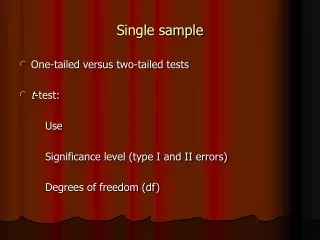
Interval or Ratio Data – consider these data first Sample compared to Population (like previous example of class to standardized test) Ho : Sample Mean - Population Mean = 0 Is the observed variability (of sample mean from population mean) more than would be expected by chance in this population Is the variability observed (potential systematic variability) ‘greater than’ the unsystematic variability? (the expected variability of means across equivalent samples) How likely is the observed Mean in the assumed Population? limited to cases where a single difference is being evaluated and the Population Mean is ‘known’ (or assumed)
One sample t-test is the mean for the sample ‘typical’ of sample means drawn from the population -is GRE for MA students different from “Mean”?? sample mean is compared to population mean to see if there is a systematic difference (more difference than would be expected if Ho true and only error variance is present) Assumptions interval/ratio data (at least being treated as interval/ratio data) sample was based on independent observations from the population normal distribution – data were drawn from one, not that data will appear to be normal if sample 50+ normality less important only serious variations from normal need be concerns standard deviation of sample is equivalent to population value (usually cannot ‘know’, since t used when pop SD unknown)
t-test for sample to population comparison is equivalent to a z-test, except you know the population mean but not the population standard deviation, so it must be estimated using the sample information.M – m(observed deviation = systematic + error)SEmean(typical deviation when Ho true = error only)estimated from the sample SD and Sample SizeWhat is the difference between z and t?So, what value for t is likely to lead you to reject the Ho?Assuming typical p = .05, two-tailed testWhat is the likely ‘critical t value’ on the Ho distribution?Implications of sample size (degrees of freedom) – critical trefresh notion of degrees of freedom t =
Research question 1 Was the Class of 1982, first Psychology Masters students, above average on the GRE test scores? GRE – Verbal GRE - Quantitative Go back to the Steps…….
Steps in Statistical Evaluation and Decision-making Pre Data Collection What are the Research Questions and Specific Hypotheses? Descriptive research – variability or structure of a variable Covariation – simple or complex Group Differences – simple or complex Characteristics of the Data Measurement type – nominal, ordinal, interval/ratio Independent or related observations Select appropriate statistical test - t-test Establish criteria for decision to be made based on test one vs. two tailed test type one error level to be used (.05) experiment-wise (family-wise alpha) (could use .025/test) since 2 means will be compared Power Analysis to determine sample size goals to determine power for sample available(n = 23) and for Type 1 error selected (power = .63 for moderate effect size, d = .5) what if wanted to detect large/small effects?
Steps in Statistical Evaluation and Decision-making Post Data Collection Check Data to See if Assumptions were Met Exploratory Data Analysis Data Clean-up – Transformations, if needed Alter Choice of Statistical test if needed Run Statistical Test and Compute Appropriate Descriptive Statistics Interpret Results of Statistical Test Can the Null Hypothesis be Rejected? If Reject – consider type I error level, confidence intervals, effect size, power If Fail to Reject – consider power (type 2 error), significance, confidence intervals Always must interpret by reference to the descriptive statistics Interpret Results Give meaning to the results in the context of the design and statistical tests used Consider limits of conclusions supported by the statistical tests Consider Design strengths and Weaknesses Generalize, as appropriate
Go to GPower to estimate power Go to the handout pack Explore the data to check data and assumptions any missing values are scores reasonable any outliers will Mean capture ‘typical’ could data be from a normal distribution? t-test is robust, so potential deviations must be clear Calculate the observed t value Decide Interpret
Research question 2 Do students in the two programs differ on GPA’s as undergraduates? GPA Total GPA JrSr Years
Situation 2 Two Independent Means – are they drawn from the same population? Like the Comparison of Chanters to Non-Chanters Ho: Sample 1 Mean - Sample 2 Mean = 0 C/C students Mean – I/O students Mean = 0 t-test for independent samples What makes them ‘independent’?
Situation 2 Two Independent Means – are they drawn from the same population? Are C/C students and I/O students drawn from the same population? Ho: Sample 1 Mean - Sample 2 Mean = 0 Assumptions interval/ratio data (or at least assumed) independent observations from the population homogeneity of variances (Tabachnick & Fidell rule of thumb) - if sample sizes same, or close, (4:1 ratio or less) - and ratio of variances 10:1 or less - probably OK if not in these limits, then use separate variances t tests and adjusted df normal distribution – drawn from, not is one, robust unless dramatic departure Most likely nonparametric alternative – Mann-Whitney U
M1 – M2Observed deviation (error + systematic) SE m-m Expected deviation when Ho true (error only) the major issue now is how to estimate the SEm-m (standard error of the sampling distribution based on the differences between two means from the same population) use group variances to estimate variability in distribution of differences between pairs of means drawn from the same population you have two samples, not just one, so how should they be combined if the samples have similar variances, can pool the two estimates into one (SPSS uses a weighted average, weighted by df in group) implications of pooling 2 dissimilar variances? if dissimilar, may want to keep them separate, especially if sample sizes differ dramatically t =
Go to the handout pack – Explore the data to check data and assumptions any missing values are scores reasonable any outliers will Mean capture ‘typical’ could data be from a normal distribution? t-test is robust, so potential deviations must be clear Calculate the observed t value Decide Interpret
How would results be changed if the 2 “outliers” were dropped? GPA = 2.75 GPA = 2.98 Both are in the C/C program
SDs are now more similar, as are the group Means, but you have lost df’s
Research Situation 3 What if the two means are from the same samples, or non-independent samples repeated measures approach (within subjects) matching in the design as a control strategy unit of analysis becomes the difference between paired scores (a transformation to restore independence) so each pair of scores contributes only a single observation to the calculation two related scores yield a single measure, without relatedness t test for paired samples
Example with “Matched” Groups The independent variable was the level of background noise present while participants studied the list of 15 verbs for two minutes. Participants were matched on GPA. The dependent variable was the number of verbs correctly recalled after a two minute delay. Low Noise (Group 1) High Noise (Group 2) Sample of Difference Scores S# X X-M1 (X-M1)2 S# X X-M2 (X-M2) 2 D D-MD (D-MD)2 1 7 -3 9 11 6 -1 1 1 -2 4 2 8 -2 4 12 5 -2 4 3 0 0 3 9 -1 1 13 6 -1 1 3 0 0 4 9 -1 1 14 6 -1 1 3 0 0 5 10 0 0 15 7 0 0 3 0 0 6 10 0 0 16 7 0 0 3 0 0 7 11 +1 1 17 8 +1 1 3 0 0 8 11 +1 1 18 8 +1 1 3 0 0 9 12 +2 4 19 9 +2 4 3 0 0 10 13 +3 9 20 8 +1 1 5 +2 4 _______________________ ________________________ ___________ 100 0 30 70 0 14 30 0 8
Research question Is there a difference between performance on the GREV and the GREQ for the 1982 class Ho = GREV – GREQ = 0
Assumptions interval/ratio data (or treated as such) independent observations normal distribution (drawn from) (note no need for homogeneity of variances) Most likely nonparametric alternatives Wilcoxon or Sign test t test for paired samples
t = Mean Difference between paired scores SE diff - how variable are difference scores (less variable than raw scores usually) The t-test for paired samples is similar to the t-test comparing a sample mean to the population mean When the Ho is true, assume that the population Mean Difference = 0 Ho: Mean difference between related scores = 0
Research question Is there a difference between performance on the GREV and the GREQ for the 1982 class Convert each student’s two scores into a single difference score (GREV – GREQ = difference) Go to the handouts … N = 23 Mean Difference = 37.39 (GRE V = 554.35; GRE Q = 516.96) SD of difference scores = 81.42 SEGREV-GREQ = 81.42/ 23 = 16.9773
Simple Group Differences – categorical data When data are nominal or ordinal in categories – questions deal with frequencies in categories So comparison involves the distribution of observations across categories • Sample to Population Ho: Differences between sample frequencies in categories and population frequencies in categories will = 0 • Two Independent Samples Ho: Differences between the two independent sample’s frequencies in categories will = 0 • Two Related Samples Ho: Differences between paired categorizations will = 0
Simple Group Differences – categorical data Chi-square Test Assumptions 1. Nominal data, or Ordinal in categories (frequencies) 2. Mutually exclusive categories 3. Independent Observations 4. No more than 20% of categories have expected frequencies < 5 5. No categories have expected frequencies < 1
To assess fit of Sample to population, must “know” population frequencies (expected frequencies) A Known Population – gender distribution in adults is 50-50 Have a sample that includes 30 females, and 20 males An Assumed Population – when Ho true Have a sample (n = 90) of cola preferences (blind taste test) Pepsi Coke RC Cola Sample 45 30 15 Assumed Pop 30 30 30 if no real differences in preferences in the population To assess where differences occur, examine ‘residuals’ differences between observed and expectedfrequencies
Single Sample - test of proportions or fit • Sample Frequencies compared to Population Expected Frequencies • - have a sample set of category frequencies, want to know • if different from frequencies expected in Population • c2= (Obs freq –Exp freq)2 • Exp freq • still like a ratio of Systematic + Error • Error • where ‘error’ or unsystematic would be the expected frequencies when chance (Ho) operates
Pepsi Coke RC Cola Sample (obs) 45 30 15 Pop (expected) 30 30 30 (45-30)2/30 + (30-30)2/30 + (15-30)2/30 = 15 c2(df, N=Sample size ) = 15 with what df? Is there evidence of ‘systematic’ variability between sample and pop? Conclusion? Look at example in CoursePack – is gender representation in MA program representative of the population
Situation 2 Comparing two independent samples TEST OF INDEPENDENCE Chi Square Like t test, can compare two samples assumed to be from the same population to see if they are different from one another when the data are categorical assume IV / DV situation, want to know if levels of IV are associated with different relative frequencies Two Independent Samples Ho: Differences between the two sample’s frequencies in categories will = 0
Same formula as used for Sample to Population have a sample set of category frequencies, want to know if different from frequencies expected in Population (when Ho true) (Obs freq –Exp freq)2 Exp freq again like a ratio of Error + Systematic Error where ‘error’ is expected frequencies when chance operates In this case, do not ‘know’ the population expected frequencies must estimate them from data (like finding SE of differences in t test) what would be the expected frequencies in the categories if two samples were from same population (nosystematic differences)? c2 =
help help No help No help Rude Rude 10 30 25 40 40 15 Polite Polite 20 20 25 40 40 30 30 50 50 80 80 Assume you are interested in the effects of request style on willingness to help Contingency Table Response Numbers represent observed frequencies of responses Request Style Response Numbers represent expected frequencies of responses if Ho true Request Style 15
Go to the calculations…… • (Obs freq –Exp freq)2 • Exp freq • (10-15)2/15 + (30-25)2/25 + (20-15)2/15 + (20-25)/2/25 = 5.33 • C2 (df, N=80) = 5.33 with what df? • Go to the example in the handouts……. • Is gender distribution same for both programs (C/C & I/O) • Power and effect size with Chi-square • ‘w’ as measure of differences in proportions • phi2 and Cramer’s V2 as effect size measures • in % of variance • w = phi or Cramer’s V
Situation 3 Two Related Samples Ho: Differences between paired categorizations will = 0 McNemar Test – variation of chi-square -like the Paired Samples t-test Must, as before, create independent observation look at categories that indicate paired responses Research question: Will people be more likely to help a child in need or an adult in need?
Help No help child 18 12 30 adult 14 16 30 32 28 60 Assume you are interested in the status of person in need on the willingness to help – observe 30 individuals responses to two possible situations Response Numbers are not independent – categories are not mutually exclusive Status So, need to ‘transform’ the data to create independent frequencies 60 observed behaviors become 30 individuals’ paired behaviors
Where is the evidence for or against ‘independence’? What cell frequencies?
Same Question – with larger sample and more extreme differences Where is the evidence for or against ‘independence’? What cell frequencies?
Asymptotic Significance: The significance level based on the asymptotic distribution of a test statistic. Typically, a value of less than 0.05 is considered significant. The asymptotic significance is based on the assumption that the data set is large. If the data set is small or poorly distributed, this may not be a good indication of significance. Exact Tests option not provided with SPSS 19 – will get with 2x2 Tables