Download
1 / 16

E N D
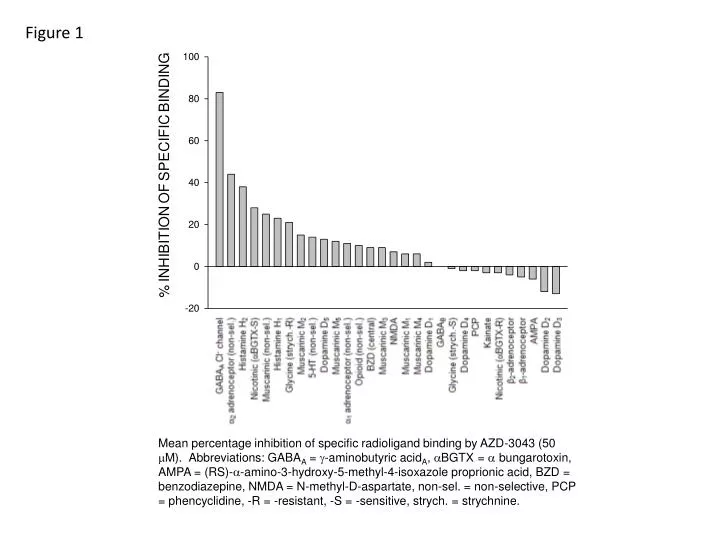
Figure 1 Mean percentage inhibition of specific radioligand binding by AZD-3043 (50 M). Abbreviations: GABAA = -aminobutyricacidA, BGTX = bungarotoxin, AMPA = (RS)--amino-3-hydroxy-5-methyl-4-isoxazole proprionic acid, BZD = benzodiazepine, NMDA = N-methyl-D-aspartate, non-sel. = non-selective, PCP = phencyclidine, -R = -resistant, -S = -sensitive, strych. = strychnine.
Figure 2 Mean percentage inhibition of specific radioligand binding by THRX-108893 (200 M), the carboxylate metabolite of AZD-3043. Abbreviations: GABAA = -aminobutyricacidA, BGTX = bungarotoxin, AMPA = (RS)--amino-3-hydroxy-5-methyl-4-isoxazole proprionic acid, BZD = benzodiazepine, NMDA = N-methyl-D-aspartate, non-sel. = non-selective, PCP = phencyclidine, -R = -resistant, -S = -sensitive, strych. = strychnine.
Figure 3 VEHICLE 1.0 0 -1.0 Representative effect of bolus IV administration of vehicle (1 mL/kg) on rat electroencephalographic activity. Administration of vehicle coincides with the vertical line on the tracing. Data points represent 2-second epochs of processed electroencephalographic activity. The activation state is expressed on the ordinate (1.0 at the top = fully activated state, -1.0 at the bottom = fully inactivated state). The vehicle did not produce a suppression of electroencephalographic activity.
Figure 4 AZD-3043 (5 mg/kg) 1.0 0 -1.0 Representative effect of bolus IV administration of AZD-3043, 5 mg/kg, on rat electroencephalographic activity. Administration of AZD-3043 coincides with the vertical line on the tracing. Data points represent 2-second epochs of processed electroencephalographic activity. The activation state is expressed on the ordinate (1.0 at the top = fully activated state, -1.0 at the bottom = fully inactivated state). AZD-3043 produced a suppression of electroencephalographic activity.
Figure 5 AZD-3043 (10 mg/kg) 1.0 0 -1.0 Representative effect of bolus IV administration of AZD-3043, 10 mg/kg, on rat electroencephalographic activity. Administration of AZD-3043 coincides with the vertical line on the tracing. Data points represent 2-second epochs of processed electroencephalographic activity. The activation state is expressed on the ordinate (1.0 at the top = fully activated state, -1.0 at the bottom = fully inactivated state). AZD-3043 produced a suppression of electroencephalographic activity.
Figure 6 AZD-3043 (20 mg/kg) 1.0 0 -1.0 Representative effect of bolus IV administration of AZD-3043, 20 mg/kg, on rat electroencephalographic activity. Administration of AZD-3043 coincides with the vertical line on the tracing. Data points represent 2-second epochs of processed electroencephalographic activity. The activation state is expressed on the ordinate (1.0 at the top = fully activated state, -1.0 at the bottom = fully inactivated state). AZD-3043 produced a suppression of electroencephalographic activity.
Figure 7 AZD-3043 (30 mg/kg) 1.0 0 -1.0 Representative effect of bolus IV administration of AZD-3043, 30 mg/kg, on rat electroencephalographic activity. Administration of AZD-3043 coincides with the vertical line on the tracing. Data points represent 2-second epochs of processed electroencephalographic activity. The activation state is expressed on the ordinate (1.0 at the top = fully activated state, -1.0 at the bottom = fully inactivated state). AZD-3043 produced a suppression of electroencephalographic activity.
Figure 8 Vehicle 1.0 0 -1.0 Representative effect (following 1 week washout) of bolus IV administration of vehicle, 1 mL/kg, on rat electroencephalographic activity. Administration of vehicle coincides with the vertical line on each tracing. Data points represent 2-second epochs of processed electroencephalographic activity. The activation state is expressed on the ordinate (1.0 at the top = fully activated state, -1.0 at the bottom = fully inactivated state). The vehicle did not produce a suppression of electroencephalographic activity.
Figure 9 Propofol (1 mg/kg) 1.0 0 -1.0 Representative effect (following 1 week washout) of bolus IV administration of propofol, 1 mg/kg, on rat electroencephalographic activity. Administration of propofol coincides with the vertical line on each tracing. Data points represent 2-second epochs of processed electroencephalographic activity. The activation state is expressed on the ordinate (1.0 at the top = fully activated state, -1.0 at the bottom = fully inactivated state). Propofol produced a suppression of electroencephalographic activity.
Figure 10 Propofol (3 mg/kg) 1.0 0 -1.0 Representative effect (following 1 week washout) of bolus IV administration of propofol, 3 mg/kg, on rat electroencephalographic activity. Administration of propofol coincides with the vertical line on each tracing. Data points represent 2-second epochs of processed electroencephalographic activity. The activation state is expressed on the ordinate (1.0 at the top = fully activated state, -1.0 at the bottom = fully inactivated state). Propofol produced a suppression of electroencephalographic activity.
Figure 11 Propofol (6 mg/kg) 1.0 0 -1.0 Representative effect (following 1 week washout) of bolus IV administration of propofol, 6 mg/kg, on rat electroencephalographic activity. Administration of propofol coincides with the vertical line on each tracing. Data points represent 2-second epochs of processed electroencephalographic activity. The activation state is expressed on the ordinate (1.0 at the top = fully activated state, -1.0 at the bottom = fully inactivated state). Propofol produced a suppression of electroencephalographic activity.
Figure 12 Propofol (10 mg/kg) 1.0 0 -1.0 Representative effect (following 1 week washout) of bolus IV administration of propofol, 10 mg/kg, on rat electroencephalographic activity. Administration of propofol coincides with the vertical line on each tracing. Data points represent 2-second epochs of processed electroencephalographic activity. The activation state is expressed on the ordinate (1.0 at the top = fully activated state, -1.0 at the bottom = fully inactivated state). Propofol produced a suppression of electroencephalographic activity.
Figure 13 Before AZD-3043 Representative electroencephalography recordings in rats prior to hypnosis with AZD-3043 (20 mg/kg).
Figure 14 Before Propofol Representative electroencephalography recordings in rats prior to hypnosis with propofol (6 mg/kg).
Figure 15 AZD-3043 (20 mg/kg) Representative electroencephalography recordings in rats during hypnosis with AZD-3043 (20 mg/kg).
Figure 16 Propofol (6 mg/kg) Representative electroencephalography recordings in rats during hypnosis with propofol (6 mg/kg).