Download
1 / 23
240 likes | 365 Views
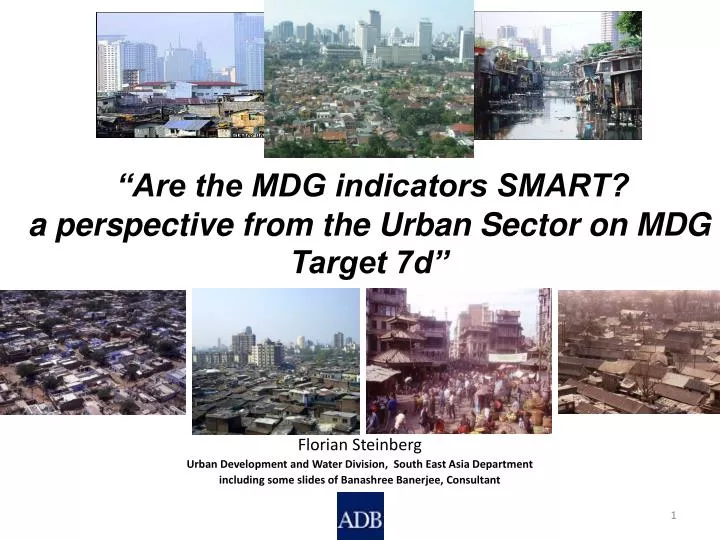
“Are the MDG indicators SMART ? a perspective from the Urban Sector on MDG Target 7d”. Florian Steinberg Urban Development and Water Division, South East Asia Department including some slides of Banashree Banerjee, Consultant.

E N D
“Are the MDG indicators SMART? a perspective from the Urban Sector on MDG Target 7d” • Florian Steinberg • Urban Development and Water Division, South East Asia Department • including some slides of Banashree Banerjee, Consultant
MDG 7D - By 2020, to have achieved a significantimprovement in the lives of at least 100 million slumdwellers DEFINING THE TARGET • Significant • Improvement • 100 million • Slum dweller ISSUES • Benchmarking: What is the benchmark to categorize “significant”? • Is it enough to state improvement of qualify further? • Was it an accurate target? How were they counted? What about geographical dispersion and densities? • Who counts as a slum dweller? Does it vary? Indicator 7.10: Proportion of urban population living in slums
Slum poverty and urban poverty in Asia Indicator 7.10: Proportion of urban population living in slums The proportion of urban population living in slums is the percentage of the population living in a slum household that lack one or more of the following basic services: improved water, improved sanitation, durable housing, sufficient living area or security of tenure. 3
WHAT ARE SLUMS? As defined by the United Nations agency UN-HABITAT, a slum is a run-down area of a city lacking one or more of the following five features: • durable housing (a permanent structure providing protection from extreme climatic conditions); • sufficient living area (no more than three people sharing a room); • access in improved water (water that is sufficient, affordable and can be obtained without extreme effort); • access to improved sanitation facilities (a private toilet, or a public one shared with a reasonable number of people); and • secure tenure (de facto or de jure secure tenure status and protection against forced eviction).
Source: UN-Habitat. 2010. Presentation by Gora Mboup, Chief, Global Urban Observatory, City Census Workshop, Beirut, Spetember2010
Prospering and transforming Asian cities: and the poor? • Greater employment opportunities : Rising incomes but growing disparity • High demand for land for development: Worsening access to land and housing • Low growth of public housing • Densification of slums – migration (renting, smaller houses) • No place in city: Growing no. of commuters • Market driven evictions • Opposition from middle class green lobby • Greater risks from living in risk areas, growing intensity and frequency of disasters – flooding, cyclones, • Greater risks of tenure insecurity • Worsening access to services • Water stress in cities- poor worst affected • Insanitary environments – poor worst affected, • More income spent on survival services – water, commuting, housing, security, transport • Income Housing 6
Indicator definition issues • The proportion of urban population living in slums is the percentage of the population living in a slum household that lack one or more of the following basic services: improved water, improved sanitation, durable housing, sufficient living area or security of tenure. • Householdlevel perspective – leaves out homeless poor • Spatial mismatch of declared slum areas - can leave out Slum Households outside these areas • Extent of deprivation – severity of slum conditions, and type of shelter deprivation • Diversity of slums within a city, and in different countries • Prior to indicators and targets being established the different levels of results must be clearly defined. ie impact, outcomes, outputs
Diversity of Slums Large variety across cities, countries Hong Kong Bangkok Kolkata Peri-urban Shanghai
Kakinada, India: locational advantage / environmental vulnerability Frequent cyclones Annual flooding Industrial pollution Saline water Over-crowding High density Fertilizer factory River Godavari To Port Slums Fishing harbor Bay of Bengal Container depot
Metro Manila: Flooding in peri-urban slums Wuzhou City: steep slope, land slide
Over-building, unsafe structures, extreme overcrowding, narrow streets Mumbai: Dharavi Delhi: Inner city
UN-Habitat’s State of the World’s Cities 2010/2011 FACTS INDICATOR RELEVANCE 100 m. represented only a fraction of total world slum population in 2000: 777 m. In 2001 an estimated 60% of the world’s total slum dwellers, 554 m. persons, lived in Asian cities. Absolute number of slum-dwellers increased from about 777 m. (2000) to 828 m. (2010) million due to rapid urbanization. Of which 506 m. in Asia alone. • Slum upgrading projects brought 227 m. out from slum conditions globally since 2000. • China and India alone achieved global slum target by improving the lives of 125 m. slum dwellers. • North Africa -only sub-region -both numbers and proportion of slum dwellers have steadily declined. Source: UN-Habitat. 2010. State of the World’s Cities 2010/2011 – Bridging the Urban Divide. Earthscan. London-Washington, DC. p. 30. ;p. 33
URBAN POPULATION AT MID - YEAR BY MAJOR AREA, PROPORTION OF URBAN POPULATION URBAN SLUM POPULATION AT MID - YEAR BY REGION AND COUNTRY (Thousands) LIVING IN SLUM AREA MAJOR AREA, REGION AND COUNTRY (Thousands) Major area, re gion, 1990 1995 2000 2005 2007 1990 1995 2000 2005 2007 1990 1995 2000 2005 2007 country or area ASIA China 314,845 380,553 454,362 530,659 561,251 43.6 40.5 37.3 32.9 31.0 137,272 153,985 169,600 174,587 173,988 Mongolia 1,264 1,357 1,397 1,464 1,497 6 8.5 66.7 64.9 57.9 57.9 865.8 905.3 906.8 847.5 866.7 Bangladesh 22,396 27,398 32,893 39,351 42,191 87.3 84.7 77.8 70.8 70.8 19,552 23,206 25,574 27,860 29,871 India 219,758 253,774 289,438 325,563 341,247 54.9 48.2 41.5 34.8 32.1 120,746 122,376 120,117 113,223 109,501 Nepal 1,692 2,361 3,280 4,269 4,712 70.6 67.3 64.0 60.7 59.4 1,194 1,589 2,099 2,591 2,798 Pakistan 34,548 40,676 47,884 55,135 58,487 51.0 49.8 48.7 47.5 47.0 17,620 20,271 23,304 26,189 27,508 Cambodia 1,222 1,613 2,161 2,753 3,022 78.9 964 1,273 1,705 2,172 2,385 Indonesia 55,922 70,188 88,918 108,828 116,832 50.8 42.6 34.4 26.3 23.0 28,407 29,912 30,620 28,574 26,852 Lao People's 629 815 1,148 1,551 1,740 79.3 1,230 Democratic Republic Myanmar 9,986 11,270 12,860 14,70 0 15,575 45.6 6,703 Philippines 29,863 37,053 44,621 53,032 56,503 54.3 50.8 47.2 43.7 42.3 16,224 18,817 21,080 23,175 23,891 Thailand 15,974 17,416 18,893 20,352 21,021 26.0 5,291 Viet Nam 13,403 16,284 19,204 22,454 23,888 60.5 54.6 4 8.8 41.3 38.3 8,109 8,897 9,366 9,274 9,137 Iraq 12,906 14,878 16,993 18,729 19,316 16.9 16.9 16.9 52.8 52.8 2,182 2,516 2,873 9,889 10,199 Jordan 2,350 3,366 3,755 4,341 4,642 15.8 686 Lebanon 2,472 2,961 3,244 3,473 3,560 53.1 1,844 S audi Arabia 12,449 14,358 16,614 19,120 20,138 18.0 3,442 Syrian Arab 6,224 7,314 8,524 10,049 10,726 10.5 1,055 Republic Turkey 33,949 38,974 44,126 49,097 51,101 23.4 20.7 17.9 15.5 14.1 7,947 8,055 7,911 7,610 7,202 Yemen 2,577 3,688 4,776 6,104 6,729 67.2 4,102 Slums in Asia China 173,988,000 India 109,501,000 Indonesia 26,852,000 14 Source: UN-Habitat. 2010. State of the World's Cities 2010/2011
UN-Habitat: Reduction of Slums in Asia • South Asia 73 m. • East Asia 72 m. • South-East Asia 33 m. • West Asia 12 % • China 65.5 m. 25% • India 58.7 m. 32% • Indonesia 21.2 m. 33% • Viet Nam 31% • Turkey 20% Are there indicators which Strategic, Measurable, Achievable, Relevant and Timebound (SMART)?
How was the target met? CHINA INDIA 59.7 m. slum dwellers assisted Slum prevalence fell from 41.5% (2000) to 28.1% (2010) Poverty alleviation and slum improvement - policies (i) increased building skills and microcredit, (ii) in-situ slum improvement projects, (iii) security of tenure in unauthorized settlements and improved access to serviced low-cost housing and subsidized housing finance; and (iv) encouraging the urban poor to participate in decision-making. • 65.5 m. urban residents • Targeted old villages within boundaries of expanding cities or temporary housing for migrant workers • Provision of access to 20 million new and affordable housing units through government equity grants. • Economic reforms, modernization, and pro-poor policies- increased incomes resulting in a reduction of slum dwellings. Source: UN-Habitat. 2010. State of the World’s Cities 2010/2011 – Bridging the Urban Divide. Earthscan. London-Washington, DC. p. 39. Source of Verification for data cited by UN-Habitat Global Urban Observatory, Personal Communication
India : Housing and Settlement Upgrading Karnataka Urban Infrastructure Development - $88 million loan; Karnataka Urban Development and Costal Environmental Management - $210million loan; Kolkota Environmental Improvement - $400million loan; Urban Water Supply & Environmental Improvement in Madhya Pradesh- $315 million – 2% to 5 % for Slums Slum after reconstruction Slum before upgrading Savings group Karnataka savings group Slum before upgrading Slum after upgrading
Indonesia : Housing and Settlement Upgrading Neighborhood Upgrading and Shelter Sector Project ($73.7m loan) Solid waste collecion Water supply Water supply Community toilets Foot paths Footpaths High-density neighborhood (Kampung)
Philippines - Settlement Upgrading Strategic Private Sector Partnerships for Urban Poverty Reduction in Metro Manila ($3.6 m grant) Before upgrading Water supply Drains and sewers Footpaths Home improvement Community center Electricity Livelihood training
Re-define/update target and indicators • habitat quality – physical characteristics and resilient technologies; • habitat density – space available per person; • access to basic infrastructure: • water • sanitation • solid waste collection • drainage and flood control • electricity and other services • Safe and clean pedestrian access; access to public transport • secure tenure (ownership housing or rental). • Gender dimensions • Vulnerability /resilience to climate change impacts
Sustainability of targets achieved • Will physical structures of habitat be maintained (or improved) over time? • Will density levels stay what they are or come down eventually? • Will basic infrastructure services be maintained by combined efforts of the authorities and communities? • And will tenure security remain unaltered, or can threats of urban renewal or redevelopment be averted?
Is MDG 7D SMART? Does the MDG indicator lend itself to a Monitoring system that allows data to be accurately collected , collated and reported on ?
Recommendations: MDG 7D. Technical level Institutional level Improving capacity of countries for data collection Improve country systems to capture, monitor and evaluate data on MDG progress Funding and donor support for the Global Urban Observatory • Redefine the target and establish suitable indicators • MDG 7D needs to be reviewed in the context of the cumulative impact of other targets since it is reliant on numerous external factors – policies, overall level of economic prosperity, rural development, healthcare, education system etc. • Localization of MDG target essential to make it SMART