Download
1 / 1
10 likes | 119 Views
Real-Time Data from the IMAGE Satellite. HENA. 1. Ring current equatorial ion flux as a function of R, MLT, & pitch angle. 2 min. Telemetry data. WWW. S. Sahm, T. G. Onsager, E. Sagawa, J. Vickroy, R. Zwickl, K. Ohtaka, M. Akioka, and T. Obara NOAA Space Environment Center. MENA.

E N D
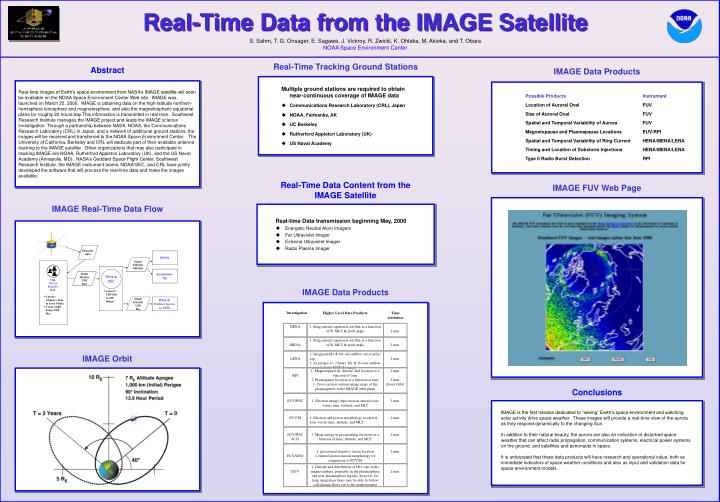
Real-Time Data from the IMAGE Satellite HENA 1. Ring current equatorial ion flux as a function of R, MLT, & pitch angle 2 min. Telemetry data WWW S. Sahm, T. G. Onsager, E. Sagawa, J. Vickroy, R. Zwickl, K. Ohtaka, M. Akioka, and T. Obara NOAA Space Environment Center MENA 1. Ring current equatorial ion flux as a function of R, MLT, & pitch angle 2 min. Single IMAGE GIF files NOAA/ SEC Anonymous ftp LENA 1. Integrated H+ & O+ ion outflow out of polar cap 2. At perigee +/- 2 hours, H+ & O+ ion outflow versus latitude, MLT, & energy 2 min. Single IMAGE UDF files Real-Time Tracking Ground Stations CRL NOAA Berkeley RAL … Abstract IMAGE Data Products • Convert UDF files to GIF images RPI 1. Magnetopause fp, density, and location as a function of time 2. Plasmapause location as a function of time 3. Cross-section contour image maps of the plasmasphere in the IMAGE orbit plane 2 min. 2 min. Every Orbit • Convert telemetry data to Level 0 Data • Create single image UDF files Single IMAGE UDF files IMAGE Partner Access to UDFs Multiple ground stations are required to obtain near-continuous coverage of IMAGE data • Communications Research Laboratory (CRL), Japan • NOAA, Fairbanks, AK • UC Berkeley • Rutherford Appleton Laboratory (UK) • US Naval Academy Possible Products Instrument Location of Auroral Oval FUV Size of Auroral Oval FUV Spatial and Temporal Variability of Aurora FUV Magnetopause and Plasmapause Locations EUV/RPI Spatial and Temporal Variability of Ring Current HENA/MENA/LENA Timing and Location of Substorm Injections HENA/MENA/LENA Type II Radio Burst Detection RPI Real-time images of Earth’s space environment from NASA’s IMAGE satellite will soon be available on the NOAA Space Environment Center Web site. IMAGE was launched on March 25, 2000. IMAGE is obtaining data on the high-latitude northern-hemisphere ionosphere and magnetosphere, and also the magnetospheric equatorial plane for roughly 20 hours/day.This information is transmitted in real time. Southwest Research Institute manages the IMAGE project and leads the IMAGE science investigation. Through a partnership between NASA, NOAA, the Communications Research Laboratory (CRL) in Japan, and a network of additional ground stations, the images will be received and transferred to the NOAA Space Environment Center. The University of California, Berkeley and CRL will dedicate part of their available antenna tracking to the IMAGE satellite. Other organizations that may also participate in tracking IMAGE are NOAA, Rutherford Appleton Laboratory (UK), and the US Naval Academy (Annapolis, MD). NASA’s Goddard Space Flight Center, Southwest Research Institute, the IMAGE instrument teams, NOAA/SEC, and CRL have jointly developed the software that will process the real-time data and make the images available. FUV/WIC 1. Electron energy deposition in auroral zone versus time, latitude, and MLT 2 min. FUV/SI 1. Electron and proton morphology in auroral zone versus time, latitude, and MLT 2 min. FUV/WIC & SI 1. Mean energy in precipitating electrons as a function of time, latitude, and MLT 2 min. FUV/GEO 1. geocoronal densities versus location 2. limited proton auroral morphology for comparison to FUV/SI 2 min. EUV 1. Density and distribution of He+ ions in the magnetosphere, primarily in the plasmasphere and near plasmasphere regions, however, for long integration times may be able to follow cold plasma flows out to the magnetopause 2 min. IMAGE FUV Web Page Real-Time Data Content from the IMAGE Satellite • Real-time Data transmission beginning May, 2000 • Energetic Neutral Atom Imagers • Far Ultraviolet Imager • Extreme Ultraviolet Imager • Radio Plasma Imager IMAGE Real-Time Data Flow IMAGE Data Products Investigation Higher Level Data Products Time resolution IMAGE Orbit Conclusions IMAGE is the first mission dedicated to “seeing” Earth’s space environment and watching solar activity drive space weather. These images will provide a real-time view of the aurora as they respond dynamically to the changing Sun. In addition to their natural beauty, the aurora are also an indication of disturbed space weather that can affect radio propagation, communication systems, electrical power systems on the ground, and satellites and astronauts in space. It is anticipated that these data products will have research and operational value, both as immediate indicators of space weather conditions and also as input and validation data for space environment models.